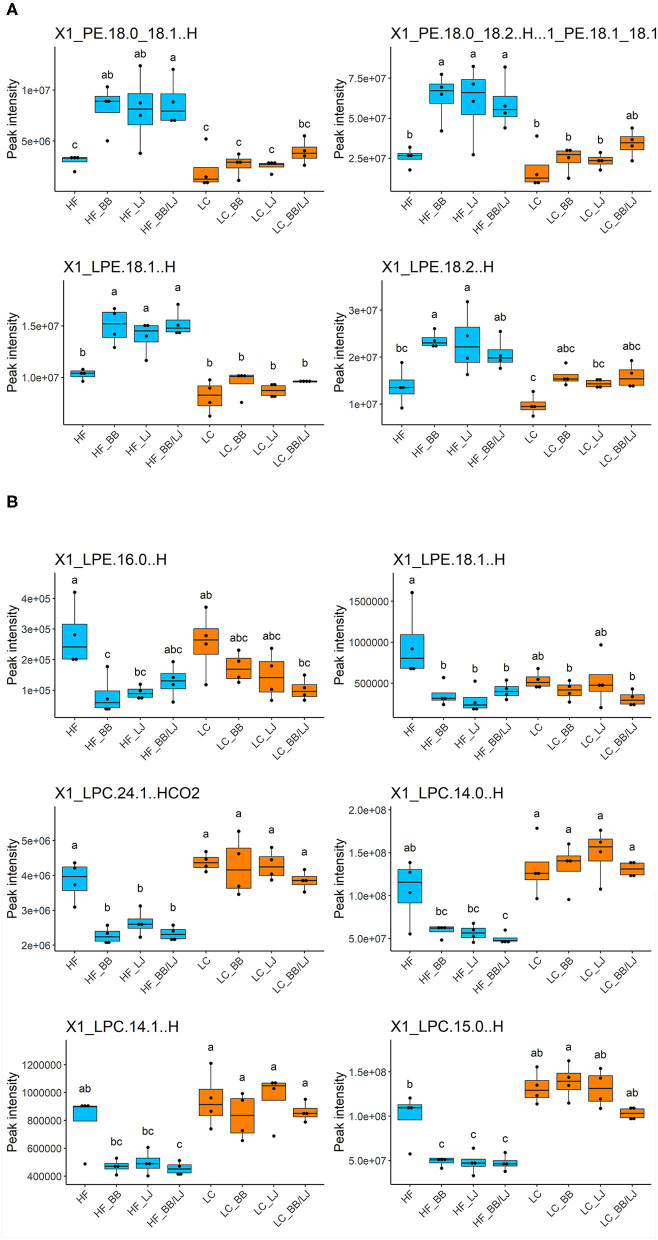
Figure 6.
Relative concentration of phospholipids in the analyzed samples. All samples were compared based on the peak intensity of each compound identified. of (A) PE and LPE on serum samples and (B) LPE and LPC on adipose tissue. HF, high-fat diet control group; LC, low-calorie diet control group; BB, blueberry extract; LJ, L. johnsonii N6.2; BB/LJ, blueberry extract + L. johnsonii N6.2. Blue bars: animals under HF diet; orange bars: animals under LC diet. Data is shown as median with max/min. Different letters on top of each box plot indicate significant differences in group means from repeated-measures ANOVA.

