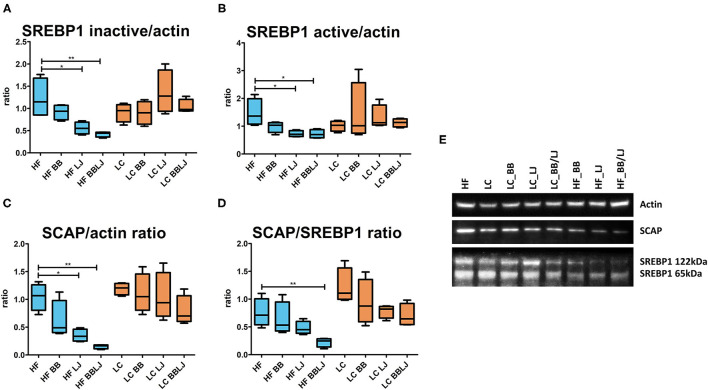
Figure 7.
SREBP1 and SCAP protein levels determined via western blot. β-actin levels were used as a loading control. (A,B) Ratios of the inactive (122 kDa) and active (65 kDa) forms of SREBP1 over β-actin (42 kDa) band intensity, respectively. (C) Ratio of SCAP over actin band intensity and (D) over the active form of SREBP1. (E) Representation of the band intensity of SREBP1, SCAP, and β-actin from each treatment group. n = 4 from 3 independent experiments. HF, high-fat diet; LC, low-calorie diet; BB, blueberry extract; LJ, L. johnsonii N6.2; BB/LJ, blueberry extract + L. johnsonii N6.2. Blue bars: animals under HF diet; orange bars: animals under LC diet. *p-value < 0.05; **p-value < 0.01.

