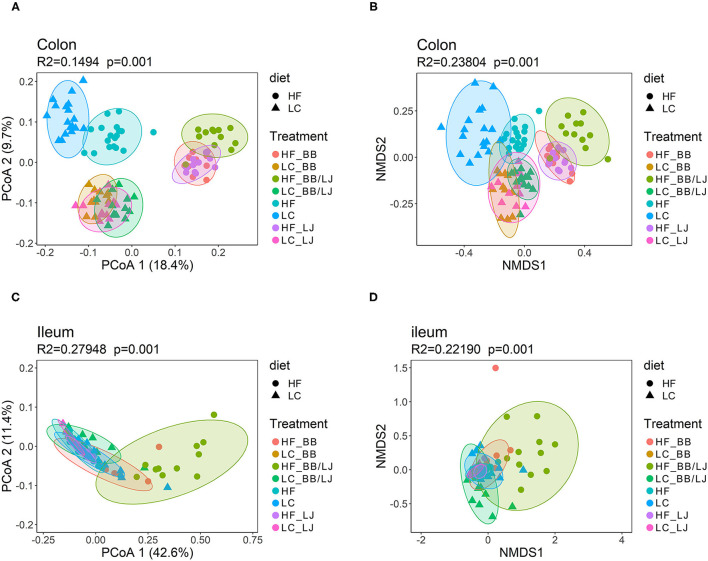
Figure 9.
β-diversity analysis using PCoA and NMDS plots. (A) PCoA and (B) NMDS plots showing the cluster distribution of samples collected from colon. (C) PCoA and (D) NMDS plots showing the cluster distribution of samples collected from ileum. PERMANOVA was used to evaluate the statistical significance of the assay. HF = control group high-fat diet; LC = control group low-calorie diet; BB = blueberry extract; LJ = L. johnsonii N6.2; BB/LJ = blueberry extract + L. johnsonii N6.2.

