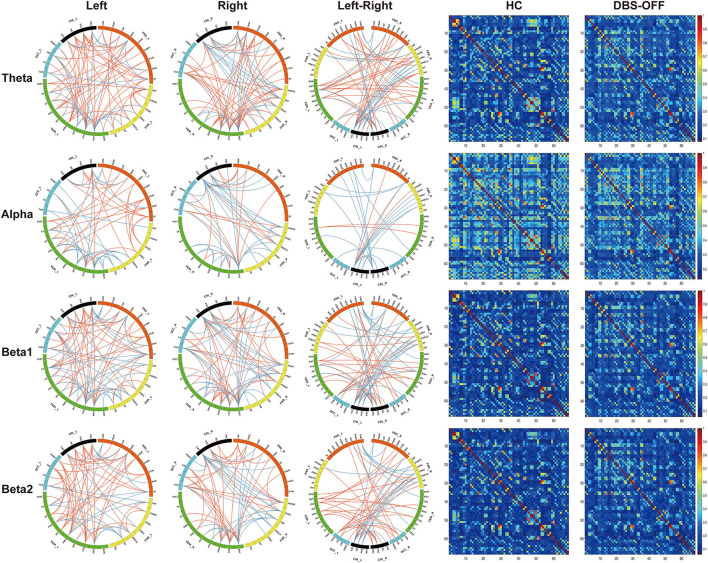
Figure 3.
Edgewise significant difference between healthy control and patients with PD in DBS-OFF: the left three columns of circular graphs show significant group differences across groups. The “Left” column shows significant group differences of functional connectivity within the left hemisphere at given frequency bands. The “Right” column shows significant group differences of functional connectivity within the right hemisphere at given frequency bands. The “Left-Right” column shows significant group differences of functional connectivity between the hemispheres at given frequency bands. The orange lines indicate increased functional connectivity, and the blue lines indicate decreased functional connectivity. The right two columns of matrixes indicate the functional connectivity of the group average at given frequency bands.

