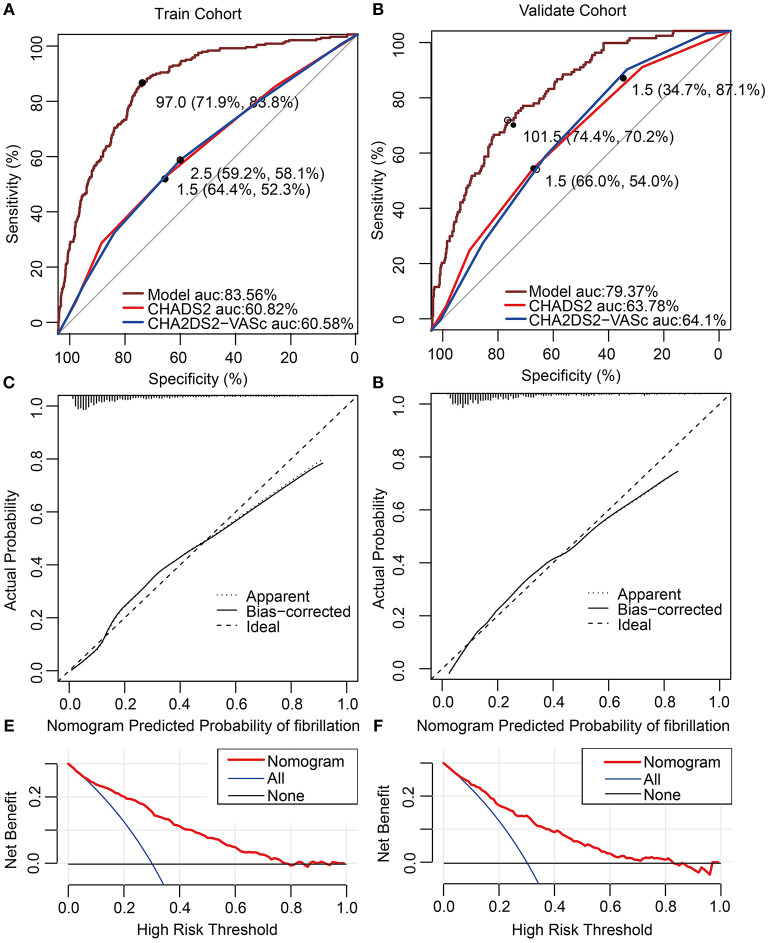
Figure 2.
(A,B) Receiver operating characteristic curve for models in predicting LAT/SEC in the training cohort and validation cohort. (C) Calibration curves for the nomogram in the training cohort. The dotted line represents the entire cohort (n = 1,239), and the solid line is the result after bias-correction by bootstrapping (1,000 repetitions), indicating nomogram performance (boot mean absolute error = 0.027). (D) Calibration curves for the nomogram in the validation cohort. The dotted line represents the entire cohort (n = 574), and the solid line is the result after bias-correction by bootstrapping (1,000 repetitions), indicating nomogram performance (boot mean absolute error = 0.020). (E,F) Decision curve analysis for the nomogram in the training cohort and validation cohort. The decision curve of the nomogram is composed of an X-axis which represents continuum of potential thresholds for LAT/SEC risk and a Y-axis which represents the net benefit which is obtained by dividing the net true positives by the sample size. The “All” curve shows the net benefit if all patients subject to transesophageal echocardiography (TEE). The “None” line shows the net benefit if no patient subject to TEE. The “Nomogram” curve shows the net benefit if it is used to select patients for TEE. For example, if the personal threshold probability of a patient was 40%, the net benefit would be 0.1 when using the nomogram to decide whether to conduct TEE examination, which means that there are 10 net detected LAT/SEC per 100 patients.

