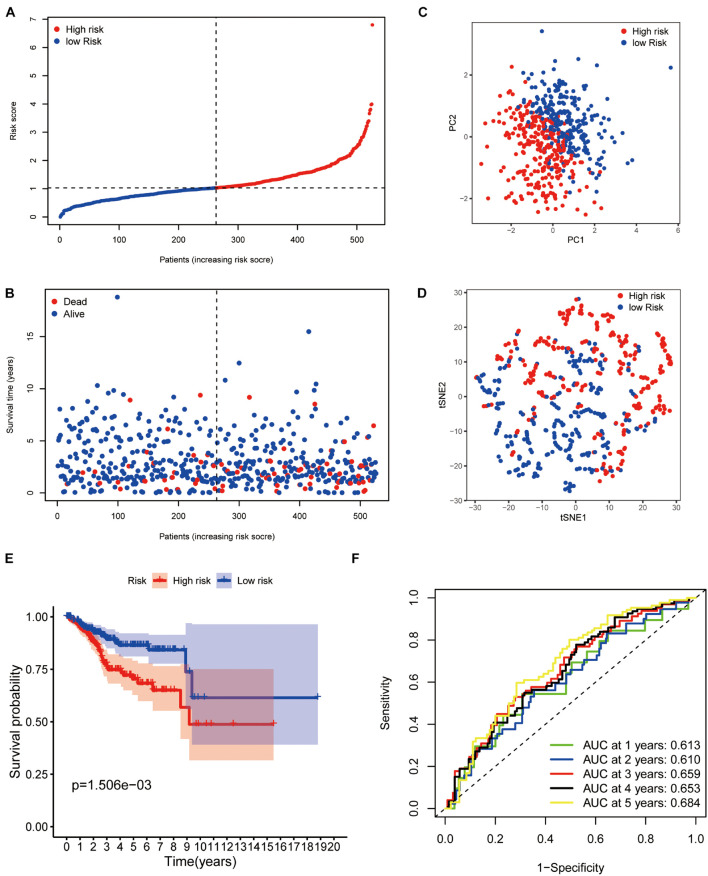
FIGURE 3.
Prognostic confirmation of the panel by DEPRGs. (A) Risk scores and (B) survival status of EC patients. (C) PCA, (D) t-SNE studying the different gene expression patterns of samples. (E) Kaplan-Meier plot showing patients in the low-risk group survived longer than patients in the high-risk group. (F) The 1-, 2-, 3-, 4-, and 5-year ROC curve to predict the survival status.

