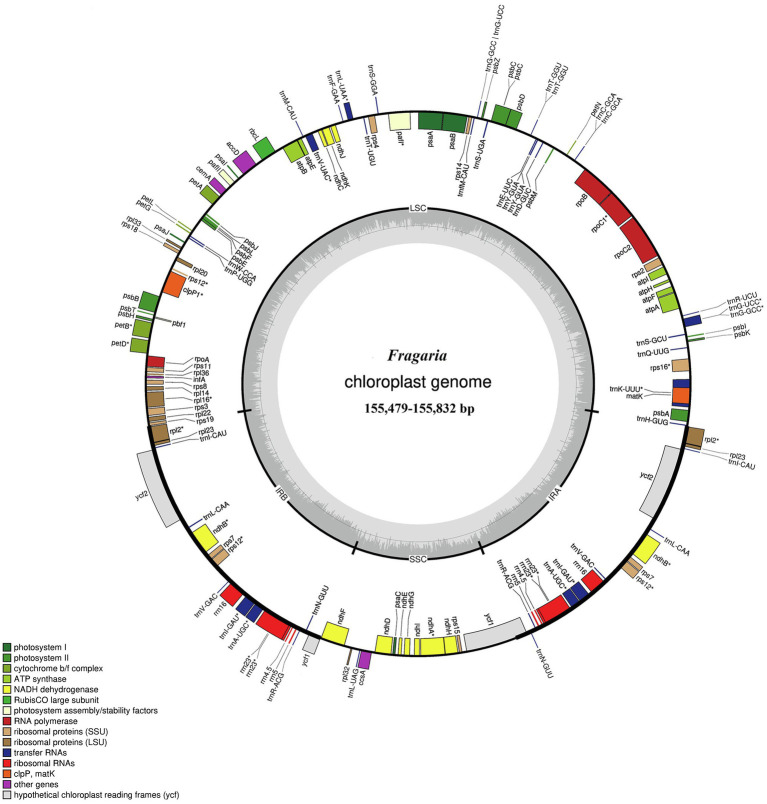
Figure 1.
Gene map of the Fragaria chloroplast genome. Genes drawn inside the circle are transcribed clockwise, and those outside are transcribed counter clockwise. Color coding is used to show genes belonging to different functional groups. The inner circle indicates the range of the long single-copy region (LSC), short single-copy region (SSC), and inverted repeat regions (IRs) and also shows a GC content graph of the genome. In the GC content graph, the dark gray lines indicate GC content, while light gray lines indicate the AT content of each locus.

