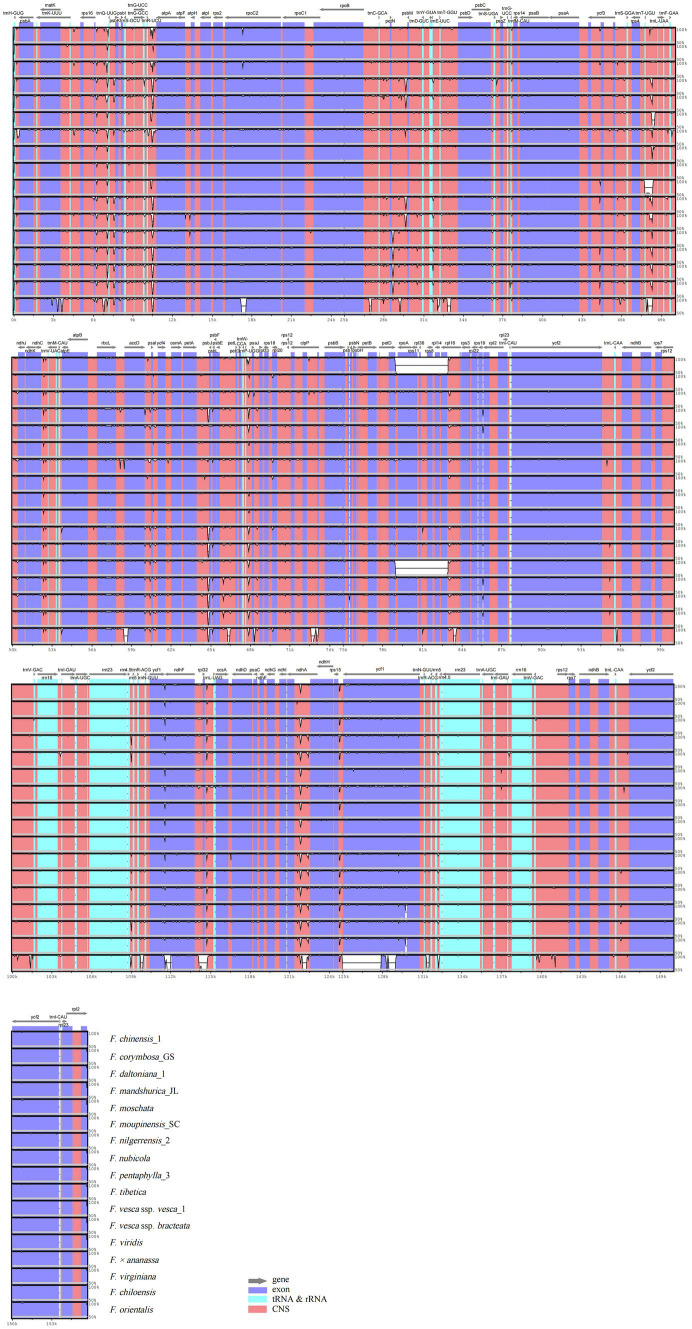
Figure 3.
Visualized alignment of the Fragaria chloroplast genome sequences with annotations, using mVISTA. Each horizontal row shows the graph for the pairwise sequence identity with the Fragaria gracilis chloroplast genome sequence. The x-axis represents the base sequence of the alignment, and the y-axis represents the pairwise percent identity ranging from 50 to 100%. Gray arrows indicate the position and direction of each gene. Red indicates non-coding sequences (CNS); blue indicates the exons of protein-coding genes (exons); lime green indicates ribosomal RNA (rRNA) or transfer RNA (tRNA) sequences.

