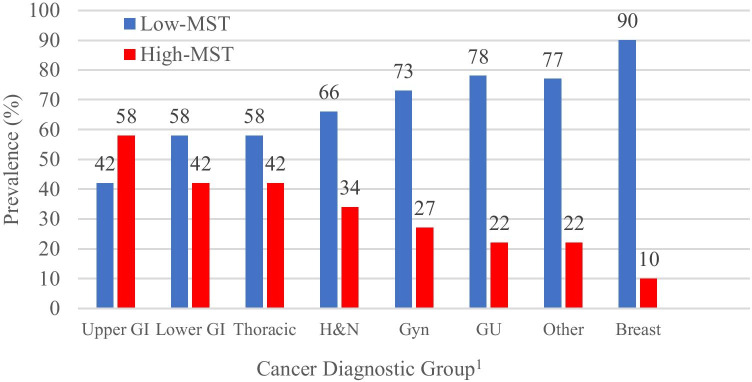
Fig. 2.
Prevalence of low versus high MST by cancer diagnostic group. 1Cancer diagnostic groups included upper GI: any biliary and liver (n = 108), esophagus (n = 58), gastric (n = 60), pancreas (n = 157); lower GI: anal (n = 18), colon (n = 228), rectum (n = 77), small bowel (n = 16); thoracic: bronchus and lung (n = 457); H&N: any head and neck primary (n = 136); Gyn: cervix (n = 60), other female genital (n = 28), ovarian (n = 60), uterine (n = 170), vagina and vulva (n = 18); GU: prostate (n = 180), renal cell carcinoma (n = 131), testis (n = 9), urinary bladder and ureter (n = 113); other: malignant melanoma (n = 199), cancer of unknown primary (n = 193), sarcoma (n = 50), central nervous system (n = 3), thyroid (n = 40); breast: any mammary primary (n = 1016). Abbreviations: MST = malnutrition score tool; N = number; upper GI = upper gastrointestinal; lower GI = lower gastrointestinal; GYN = gynecologic; GU = genitourinary; H&N = head and neck

