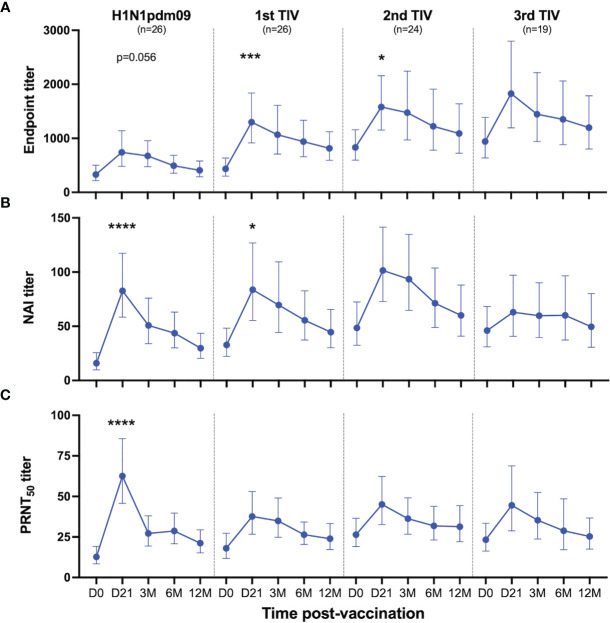
Figure 3.
Antibody responses to NA induced by H1N1pdm09 and TIV vaccination. Health care workers in the repeated group received two or three trivalent influenza vaccines (TIV) in the four subsequent seasons after the 2009 pandemic during the five-year study. Blood samples were collected pre-season (D0) and 21 days, 3, 6 and 12 months (D21, 3M, 6M, 12M, respectively) after each vaccination. Antibody responses were measured by ELISA (A), ELLA (B) and plaque reduction neutralization assay (C) after vaccination with H1N1pdm09 and the first, second or third TIV. All vaccinated HCWs in the repeated group is included in this figure regardless of their vaccination intervals. Data are shown as geometric mean with 95% confidence intervals. A linear mixed effects model with adjustments for demographic factors was used to determine statistical difference between antibody titers measured on day 0 and day 21 for each vaccination. *P ≤ 0.05, ***P ≤ 0.001, ****P ≤ 0.0001.

