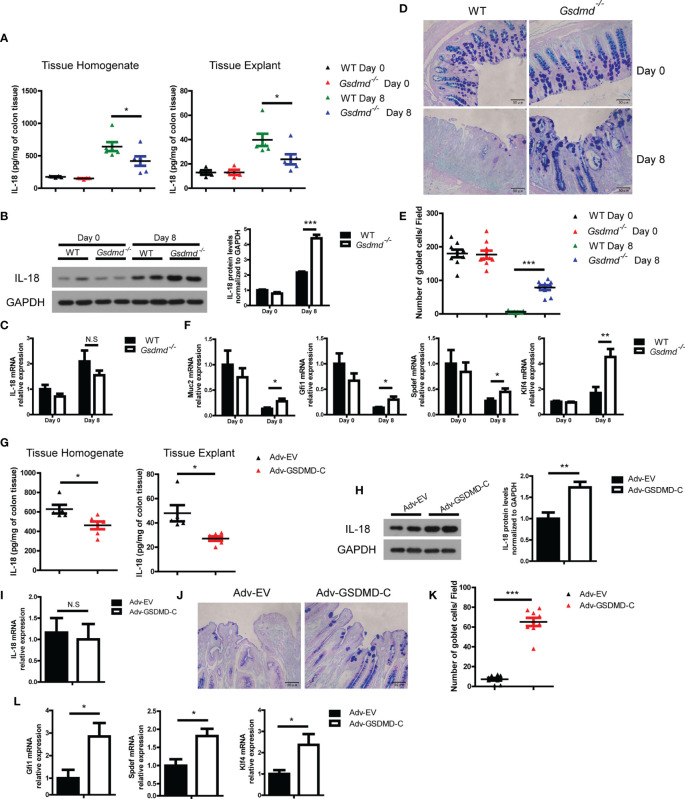
Figure 6.
GSDMD increases IL-18 release during DSS-induced colitis. (A) ELISA analysis of IL-18 protein levels in WT or Gsdmd-/- mouse colon homogenates or cultured colon tissue on Day 0 or Day 8 of the colitis model, as shown in Figure 1G (n=4/6 per group). (B) Immunoblot analysis of IL-18 expression in WT or Gsdmd-/- mouse colons on Day 0 or Day 8 of the colitis model, as shown in Figure 1G . The quantitative analysis of IL-18 is shown on the right side. (C) Quantitative mRNA expression of IL-18 from WT or Gsdmd-/- mouse colons on Day 0 or Day 8 of the colitis model, as shown in Figure 1G . (D, E) AB-PAS staining of the representative colons from the mice on Day 0 or Day 8 of the colitis model, as shown in Figure 1G (400× magnification). The number of goblet cells per field (E) was determined as in (D) (n = 9/group). (F) Quantitative mRNA expression of the indicated genes from the colon of WT or Gsdmd-/- mice on Day 0 or Day 8 of the colitis model, as shown in Figure 1G . (G) ELISA analysis of IL-18 protein levels in the colons of Adv-EV- (n = 5) or Adv-GSDMD-C-treated (n = 6) WT mice on Day 8 of the colitis model, as shown in Figure 3B . (H) Immunoblot analysis of IL-18 expression in the colons of Adv-EV- or Adv-GSDMD-C-treated WT mice on Day 8 of the colitis model, as shown in Figure 3B . The quantitative analysis of IL-18 is shown on the right side. (I) Quantitative mRNA expression of IL-18 in the colons of Adv-EV- or Adv-GSDMD-C-treated WT mice on Day 8 of the colitis model, as shown in Figure 3B . (J, K) AB-PAS staining of the representative colons from the Adv-EV- or Adv-GSDMD-C-treated WT mouse colon on Day 8 of the colitis model, as shown in Figure 3B (400× magnification). The number of goblet cells per field (K) was determined as in (J) (n = 9/group). (L) Quantitative mRNA expression of the indicated genes from the colons of Adv-EV- or Adv-GSDMD-C-treated WT mice on Day 8 of the colitis model, as shown in Figure 3B . Data are representative of two (A, B, G, H) or three (C-F, I–L) independent experiments (mean ± SEM in A–C, E–I, K–L). *p < 0.05, **p < 0.01, ***p < 0.001 by Student’s t test. N.S, no significance.

