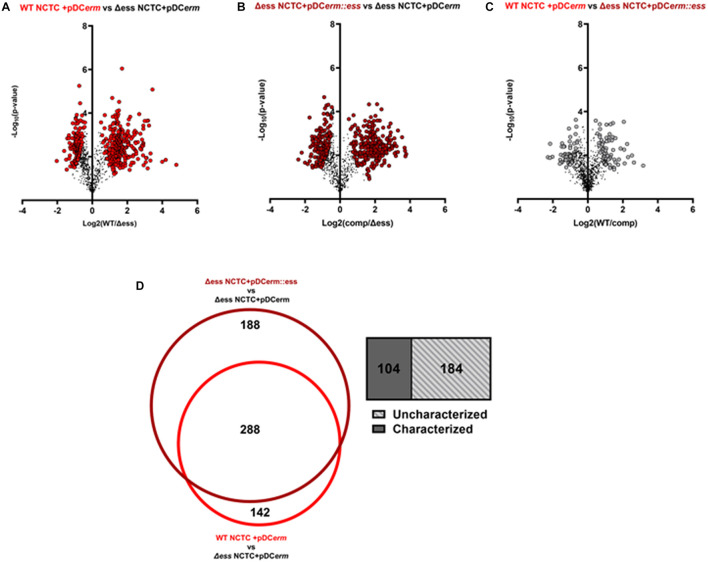
FIGURE 4.
(A) Volcano plots demonstrating a binary comparison of differentially abundant proteins in GBS culture supernatant of WT and S protein deletion strains. Proteins with pi-score > 1.5 are shown in bright red. (B) Volcano plots demonstrating a binary comparison of differentially abundant proteins in GBS culture supernatant of complemented and S protein deletion strains. Proteins with pi-score >1.5 are shown in dark red. (C) Volcano plots demonstrating a binary comparison of differentially abundant proteins in GBS culture supernatant of complemented and S protein deletion strains. Proteins with pi-score > 1.5 are shown in gray. (D) Venn diagram showing overlap of differentially abundant proteins when making binary comparison of WT and complemented strains with S protein deletion strain. Box-plot demonstrating proportion of overlapping proteins determined to be uncharacterized on UniProt.

