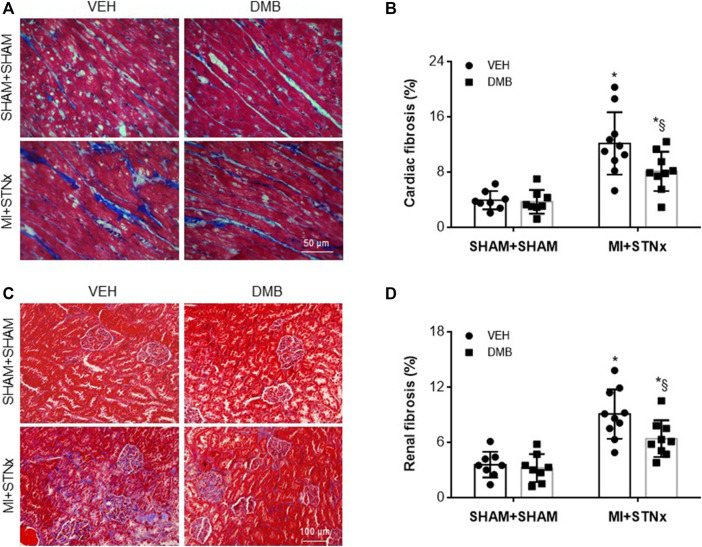
FIGURE 5.
Representative Masson Trichrome staining of the heart (A) and kidney (C) sections and effects of CRS2 and DMB treatment on cardiac (B) and renal fibrosis (D). Data are expressed as mean ± SE (n = 8–10 for each group). *p < 0.05 vs SHAM + SHAM + VEH; §p < 0.05, MI + STNx + DMB vs MI + STNx + VEH.

