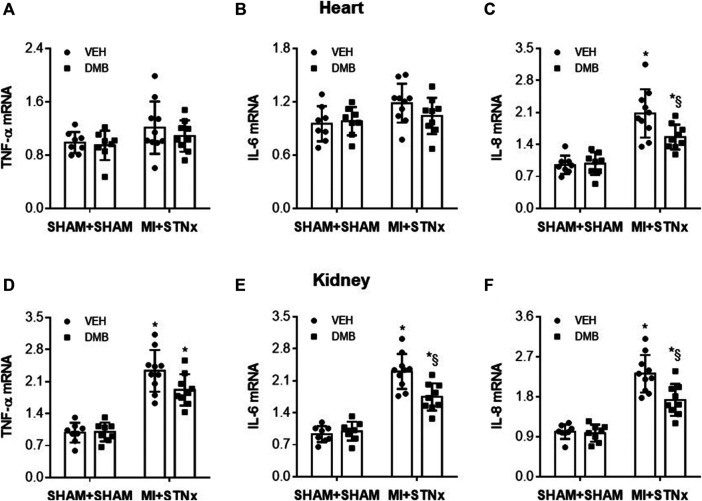
FIGURE 8.
Effects of CRS2 and DMB treatment on gene expression of pro-inflammatory cytokines tumor necrosis factor (TNF)-α (A) and (D) and interleukin (IL)-6 (B) and (E) and IL-8 (C) and (F) in the heart and kidney, respectively. Data are expressed as mean ± SE (n = 8–10 for each group). *p < 0.05 vs SHAM + SHAM + VEH; §p < 0.05, MI + STNx + DMB vs MI + STNx + VEH.

