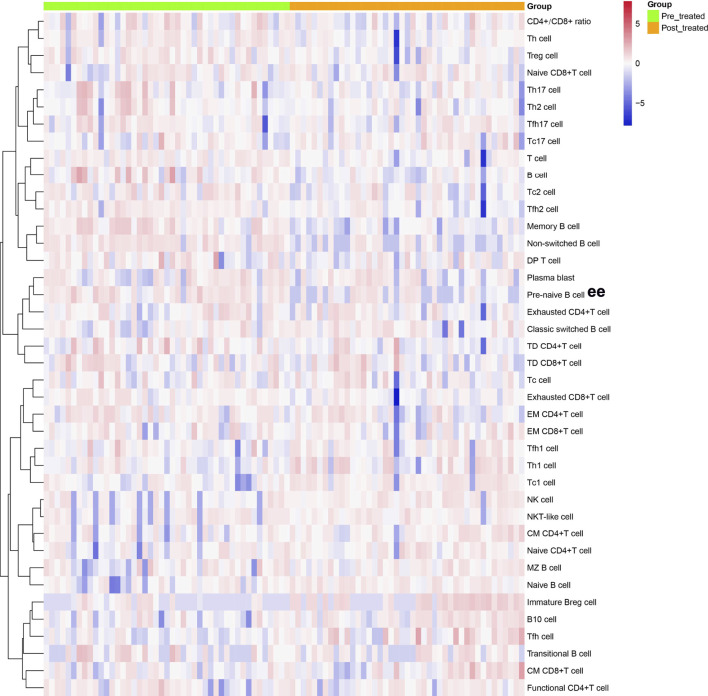
FIGURE 1.
Cluster analyses of immune cell frequency in the patients with AS before and after treated with secukinumab. Each column represented individual patients with AS. Pre-treatment group was marked as green and post-treatment group was marked as orange. The rows represented immune cell subsets that are differentially expressed. The magnitude of parameter expression was color-coded with red for an increase in expression and blue for a decrease in expression. Th cell, helper T cell; Treg cell, regulatory T cell; Tc cell, cytotoxic T cell; Tfh cell, follicular helper T cell; DP T cell, double positive T cell; TD, terminally differentiated; EM, effector memory; CM, central memory; NK cell, natural killer cell; Breg cell, regulatory B cell.

