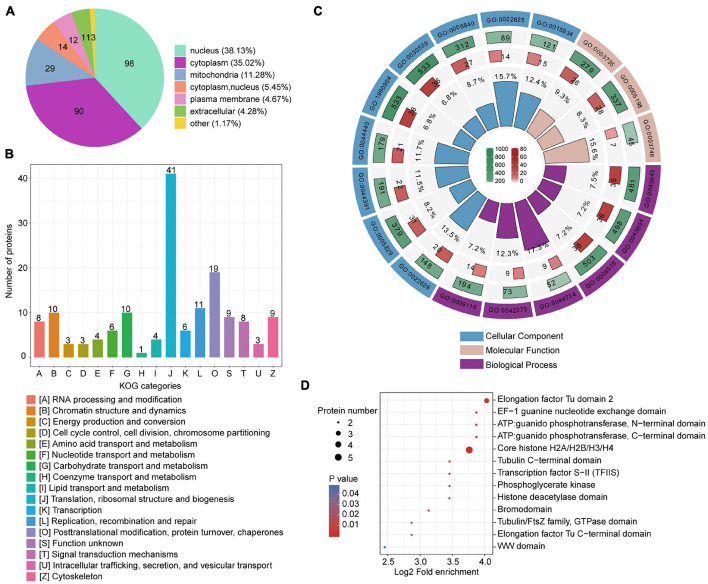
FIGURE 1.
Compartmental Kla protein distribution and enrichment analysis. (A) Pie chart indicating subcellular lactylated protein localization. (B) KOG functional classification of identified lactylated proteins. (C) Enrichment analysis of GO items. From outside to inside: items, number of background proteins, number of identified proteins, and degree of enrichment. (D) Bubble plot displaying domain enrichment of lactylated proteins.

