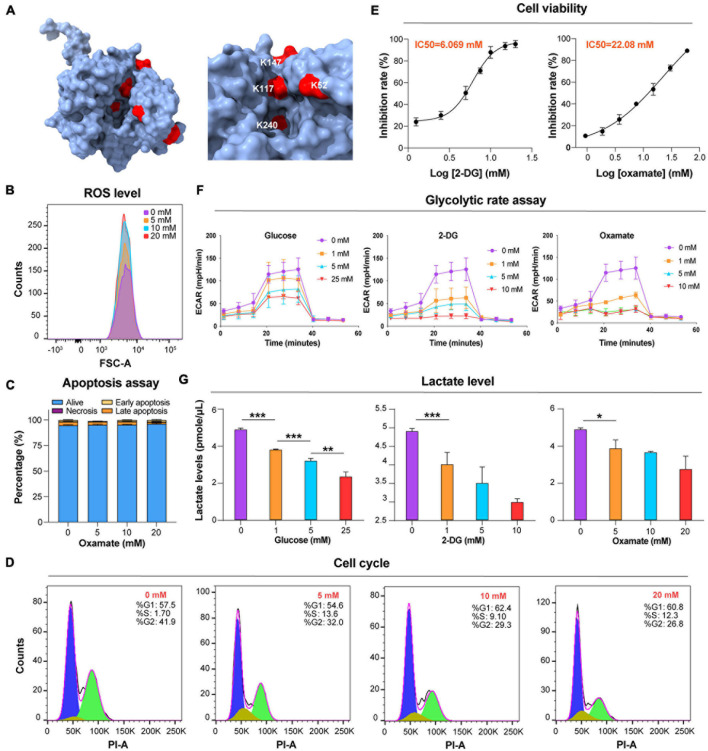
FIGURE 4.
Glucose and glycolytic enzyme inhibitors mod ulate lactate levels. (A) Lactylated sites detected in ALDO are represented by the three-dimensional structure of protein. The lactylated sites are shown in red (PDB: 1F2J). (B) Flow cytometry determination of cellular ROS levels of T. brucei with DHE after exposure to the different concentrations of oxamate for 24 h. (C) Analysis of apoptosis/necrosis in T. brucei after exposure to different concentrations of oxamate for 24 h. (D) Cell cycle distribution analysis of T. brucei exposure to different concentrations of oxamate for 24 h based on the flow cytometry results. (E) T. brucei were incubated for 24 h in presence of variable amounts of indicated inhibitors. IC50 and inhibition calculated by PrestoBlue as described in Star Methods. (F) Extracellular acidification rate (ECAR) after sequential addition of rotenone and antimycin A (Rot/AA; mitochondrial ETC inhibitors) and 2-DG. (G) Lactate levels were measured with lactate fluorescence kit. N = 3 biological replicates. Statistical significance was determined by one-way ANOVA followed by Sidak’s multiple comparisons test. P values were determined using the Student’s t-test. *P < 0.05, **P < 0.01, and ***P < 0.001 versus control.

