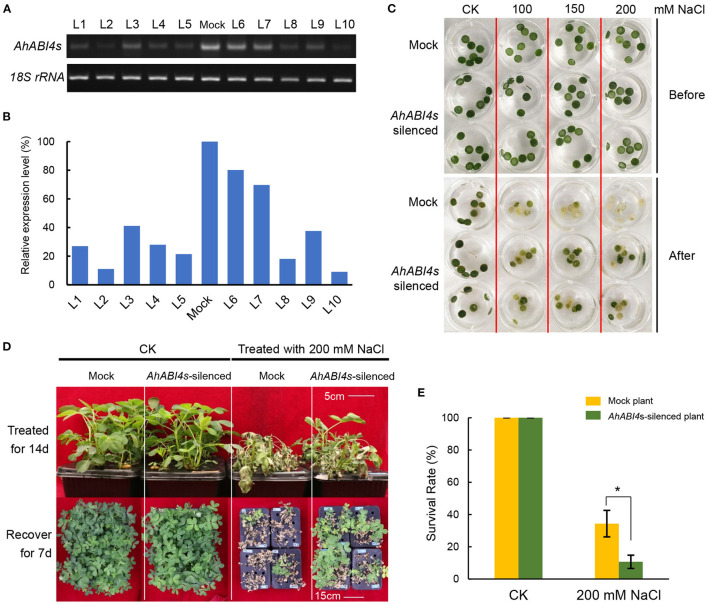
Figure 1.
Phenotype analysis of AhABI4s-silenced lines under salt-stress. (A,B) Detection of AhABI4 mRNA level at 7 d after inoculation. Target product quantity was calculated by gray scanning in ImageJ (NIH, Bethesda, MD, USA). The relative AhABI4s expression level in AhABI4s-silenced plants was compared against that in Mock plants. (C) Leaf disc assay under salt-stress. Two or three discs were punched from each seedling depending on leaf size and quantity. More than 20 seedlings were tested in each replicate. (D) Phenotypes of Mock and AhABI4s-silenced seedlings after the 14-day salt-stress treatment and 7-day recovery. (E) Survival rates of Mock and AhABI4s-silenced seedlings after the 7-day recovery with or without salt-stress treatment. At least 100 seedlings were tested per treatment and three independent experiments were performed. The student's t-test was performed to detect significant differences in survival rate between Mock and AhABI4s-silenced plants. *P < 0.05.

