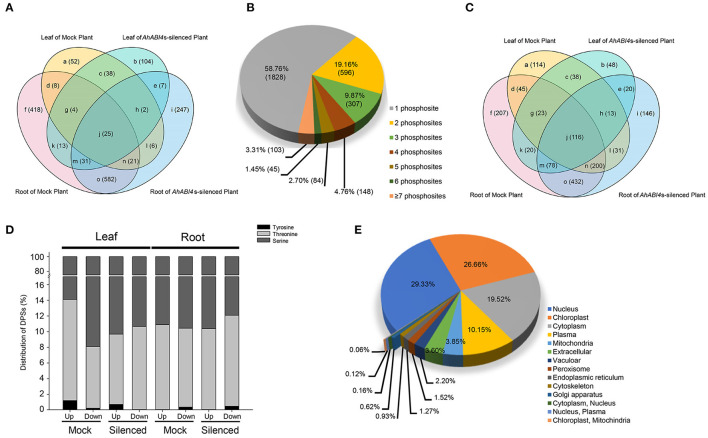
Figure 3.
Characteristics of the proteomic and phosphoproteomic data in Mock and AhABI4s-silenced peanut leaf and root. (A) Overlap of the DEPs identified in different samples in proteomic data. (B) Proportions of single and multiple phosphorylation sites per DEP in phosphoproteome. (C) Overlap of the DEPs identified in different samples of phosphoproteomic data. (D) Proportions of different phosphorylated amino acid residues in each sample. (E) Predicted subcellular localization of DEPs in proteome and phosphoproteome.

