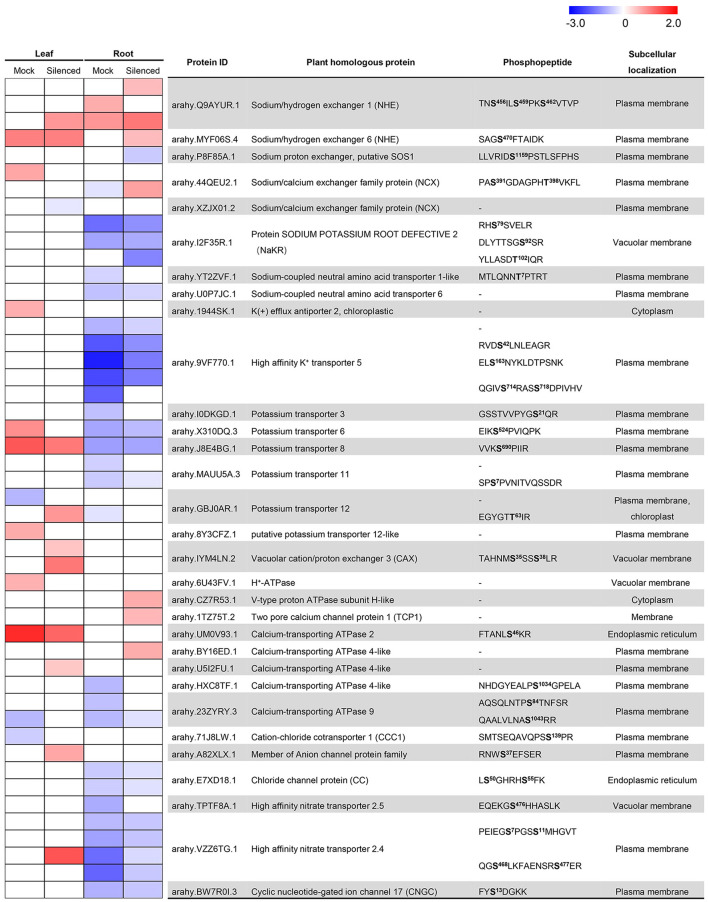
Figure 4.
Detection and change ratios of ion transporters and exchangers identified in proteomic and phosphoproteomic data. The color display changing ratio (log2 transformed) per protein/site after salt-stress treatment according to the indicated gradient. In the heatmap, the row corresponding to “-” indicated change ratios of the gene at the translational level. Predicted phosphorylation sites marked in bold; superscript indicates the position of modified amino acid in the peptide chain.

