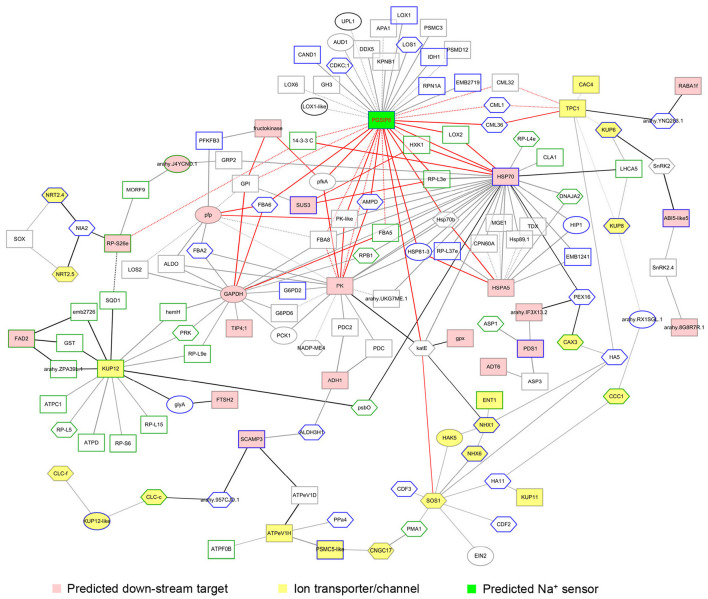
Figure 5.
Visualization of the salt-stress response network regulated by AhABI4s. FASTA format of amino acid sequences of identified differentially expressed proteins (DEPs) was submitted to STRING. Interaction databases of Arabidopsis thaliana, Glycine max, and Medicago truncatula served as references. The minimum required interaction score was >0.7. Certain ion transporters/channels with interaction scores between 0.5 and 0.7 were reserved. Pink and yellow nodes represent predicted downstream targets of AhABI4s and the ion transporters/channels affected by silencing of AhABI4s. Board paint of each node indicated the expressed tissue of each protein. Green and gray boards mark proteins expressed in leaves and roots, respectively. Blue boards mark proteins expressed in both leaves and roots. Protein changes at translation, phosphorylation, or both levels represented by rectangle, hexagon, and ellipse, respectively. Widths of edges between nodes represent combined scores.

