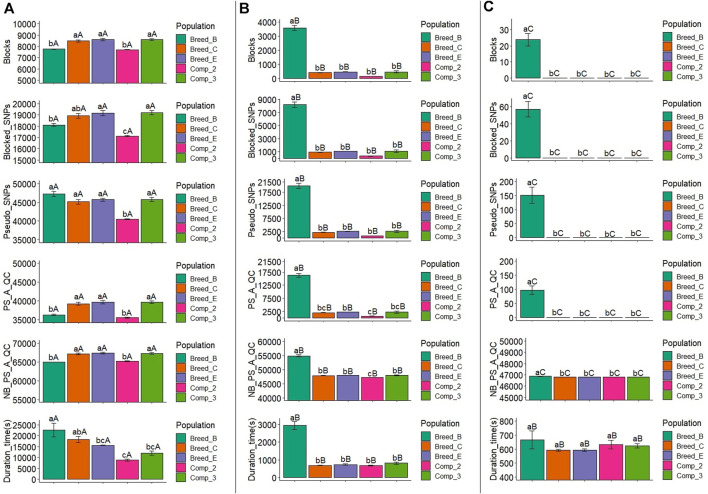
FIGURE 3.
Average number of blocks (Blocks) spanning two or more SNPs, markers within blocks (Blocked_SNPs), pseudo-SNPs (Pseudo_SNPs), pseudo-SNPs after quality control (PS_A_QC), non-blocked SNPs plus pseudo-SNPs after quality control (NB_PS_A_QC), and computing time to obtain the pseudo-SNPs (Duration_time) in the simulation for a trait with moderate heritability (h2 = 0.30). A, B, and C show the results for haplotype blocks with LD thresholds of 0.1, 0.3, and 0.6, respectively. Breed_B, Breed_C, and Breed_E: simulated pure breeds with different genetic backgrounds; Comp_2 and Comp_3: composite breeds from two and three pure breeds, respectively. The same lower- or upper-case letters mean no statistical difference comparing populations within LD thresholds and LD threshold across populations, respectively, at 5% significance level by the Tukey test.

