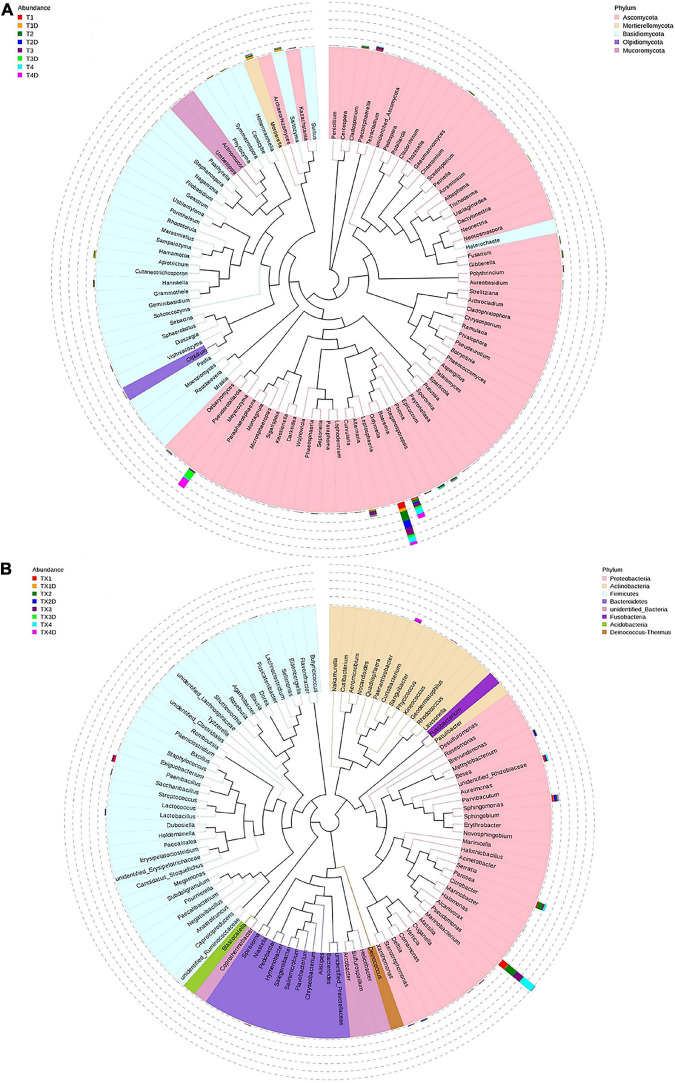
FIGURE 5.
Maximum likelihood tree of the 100 most abundant fungal (A) and bacterial (B) genera in the eight group samples from tobacco leaves infected with D. segeticola. obtained by analysis of ITS rDNA and 16S rRNA pyrosequencing data. A color-coded bar plot shows the distribution of each fungal and bacterial genus in different groups.

