FIGURE 3.

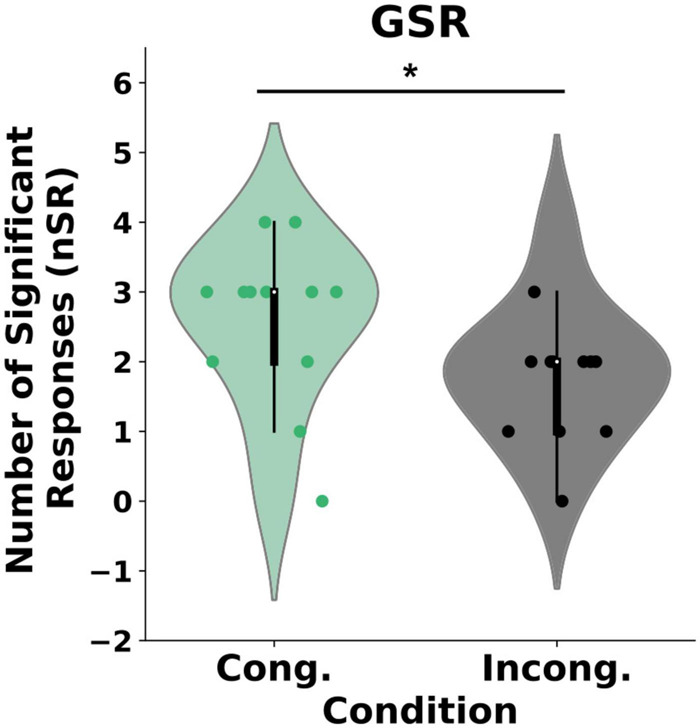
GSR results. The plot represents the difference between the groups in the number of galvanic skin responses (nGSR) post stabbing event. *P < 0.0.

GSR results. The plot represents the difference between the groups in the number of galvanic skin responses (nGSR) post stabbing event. *P < 0.0.