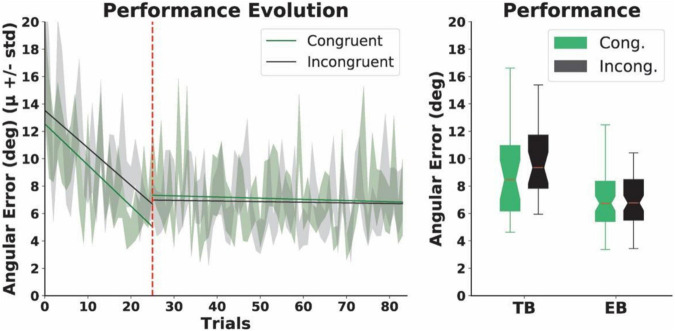
FIGURE 5.
Motor performance. Left: the evolution of angular errors. The dashed red line indicates the end of the Training Block (TB) and the beginning of the Experimental Block (EB). The solid lines represent linear regression models for the angular errors in each condition in the TB and EBs, before or after the dashed red line, respectively. Right: total angular errors. Boxplots represent angular errors for the two conditions in the training and EBs, respectively. No differences were found between the groups.

