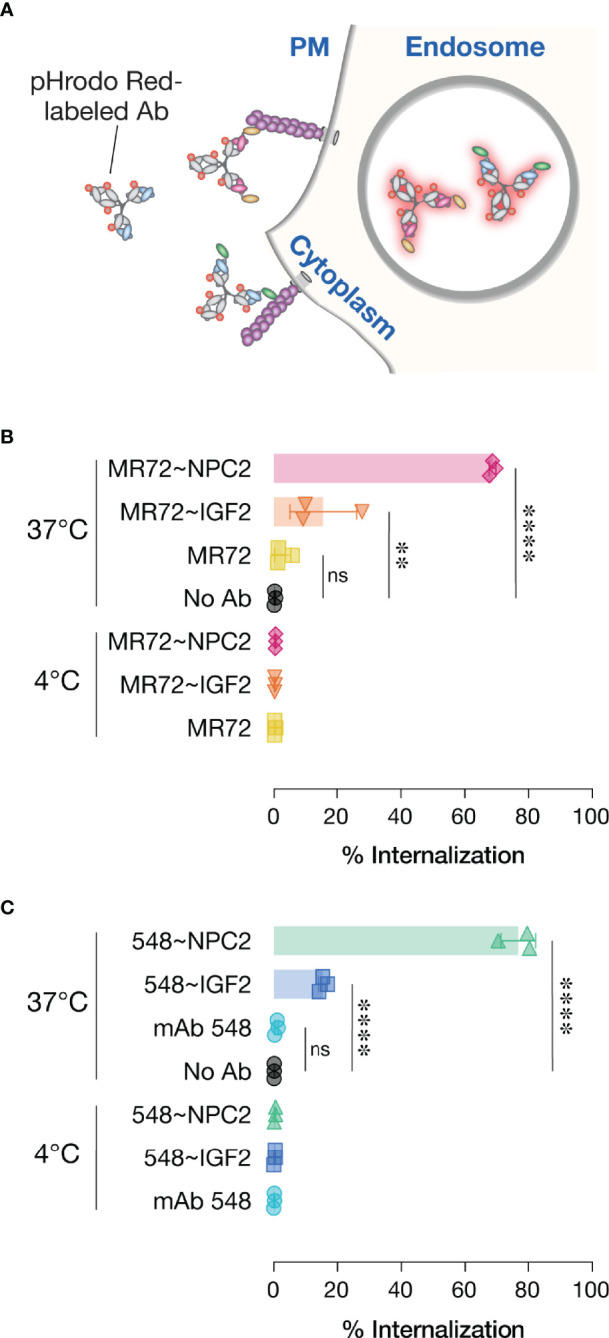
Figure 6.

Cellular internalization of Trojan horse bsAbs. (A) Schematic of pHrodo Red-labeled antibody internalization experiment. (B, C) Labeled antibodies were incubated with cells at either 4°C to prevent internalization or 37°C to allow internalization prior to analysis by flow cytometry. Data points represent the percentage of pHrodo Red positive cells; bars represent means ± SD from 3 independent experiments. Group means (bars) were compared using one-way ANOVA with Turkey’s multiple comparisons test. (****P < 0.0001; **P < 0.01; ns, not significant).
