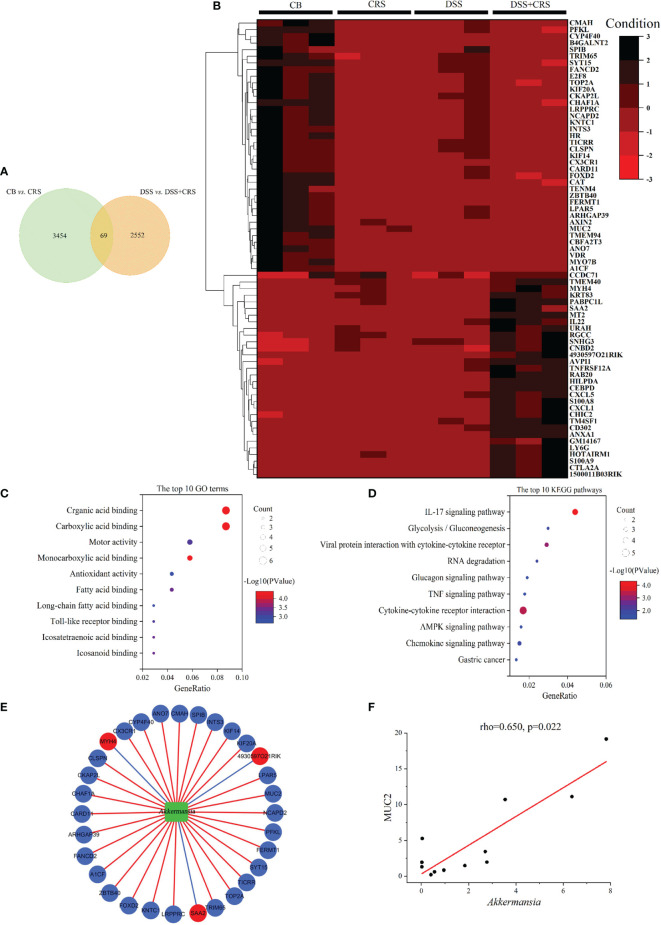
Figure 5.
DEGs under CRS were analyzed by high-throughput RNA-Seq. (A) Venn diagram showing 69 DEGs changed under CRS from the two comparisons. (B) Heat-map presented 69 DEG in the two comparisons (n = 3). (C) The 10 most disordered GO terms were identified from the 69 DEG in the two comparisons. (D) The top 10 KEGG pathways were identified from the 69 DEG in the two comparisons; (E) Network visualized the correlations between A. muciniphila and genes. Green node represented A muciniphila. Red and Blue nodes represented the raising and lowering of DEGs. Blue lines represented negative correlation, and red lines represented positive correlation; (F) Scatterplot showing that MUC2 was positively correlated with A. muciniphila.

