
FIGURE 1.
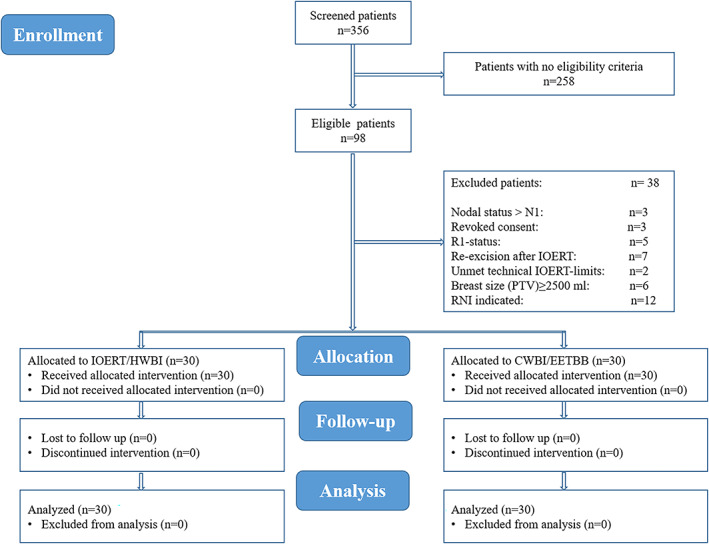
CONSORT subject flow diagram shows the number of subjects screened, enrolled, randomized, and included in the primary analysis
Official websites use .gov
A
.gov website belongs to an official
government organization in the United States.
Secure .gov websites use HTTPS
A lock (
) or https:// means you've safely
connected to the .gov website. Share sensitive
information only on official, secure websites.
CONSORT subject flow diagram shows the number of subjects screened, enrolled, randomized, and included in the primary analysis