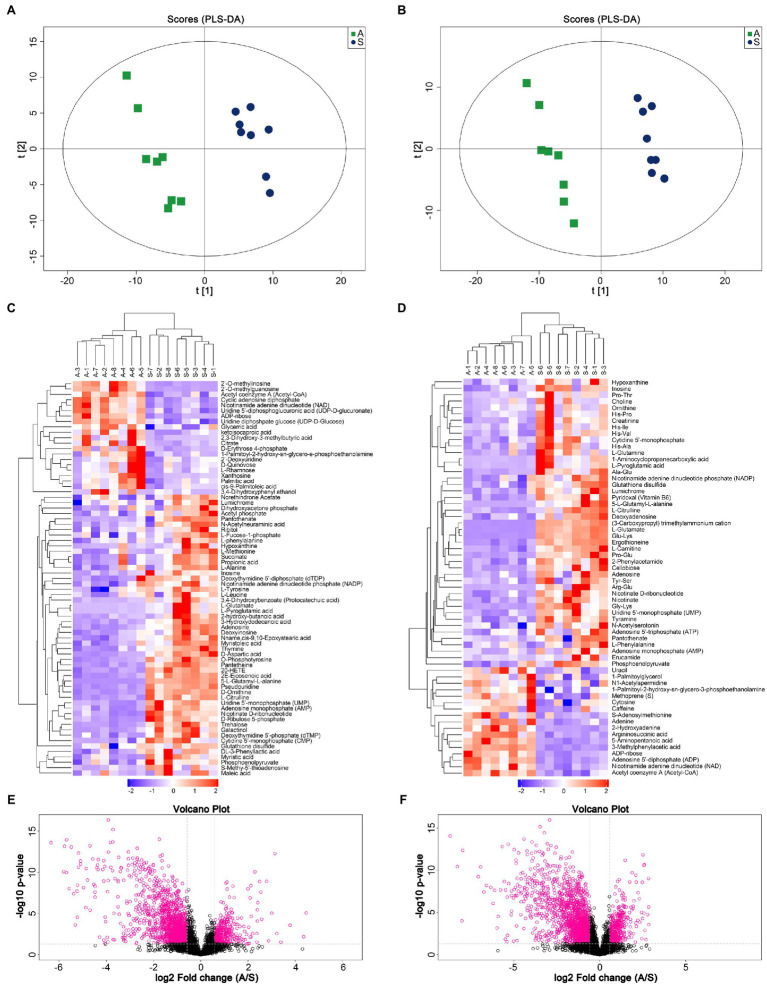
Figure 1.
Metabolic profile analysis of Apramycin-resistant and sensitive Salmonella. (A) PLS-DA score of Apramycin-resistant and sensitive Salmonella in negative ESI modes. (B) PLS-DA score of Apramycin-resistant and sensitive Salmonella in positive ESI modes. (C) Cluster analysis of different metabolites in negative ESI modes. (D) Cluster analysis of different metabolites in positive ESI modes. (E) Volcano map of the metabolites of Apramycin-resistant Salmonella in negative ESI modes. (F) Volcano map of the metabolites of Apramycin-resistant Salmonella in positive ESI modes. “A” represents Apramycin-induced resistant Salmonella ATCC13312 and “S” represents Apramycin-sensitive Salmonella ATCC13312.

