Figure 1.
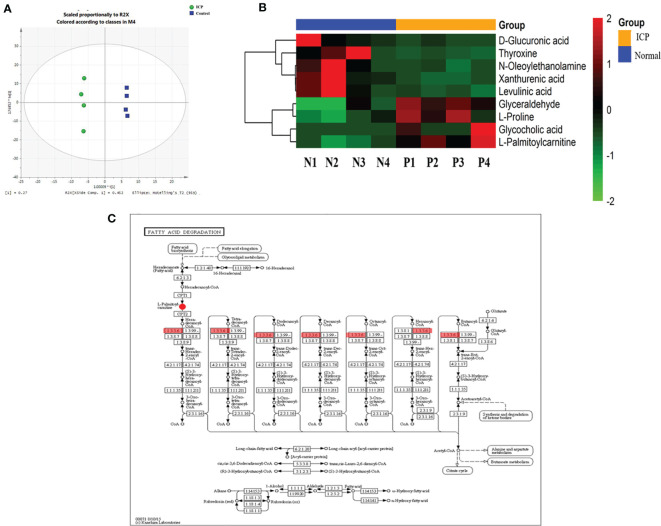
Integrated proteomics and metabolomics analysis. (A) OPLS-DA score plots derived from analysis of placental tissue by ultra-performance LC-Q-TOF/MS in positive and negative ionization modes. R2X and R2Y indicate the fraction of the variables explained by the model, while Q2 shows the predictive abilities of the model. R2X = 0.452, R2Y = 0.998, and Q2 = 0.803. The green circle is labeled as ICP; the blue square is labeled as control; (B) Cluster analyses of differentially expressed placental metabolites among pregnant women with ICP (P) and healthy pregnant women (N). Hierarchical cluster analyses of the nine differentially expressed metabolites revealed significantly altered levels in ICP patients. Metabolite levels are shown as colored boxes; red, high level; green, low level; (C) Part of the fatty acid metabolism pathway. The 1.3.3.6 are labeled as ACOX1. ACOX1 maintains a regulatory relationship with L-palmitoylcarnitine.

