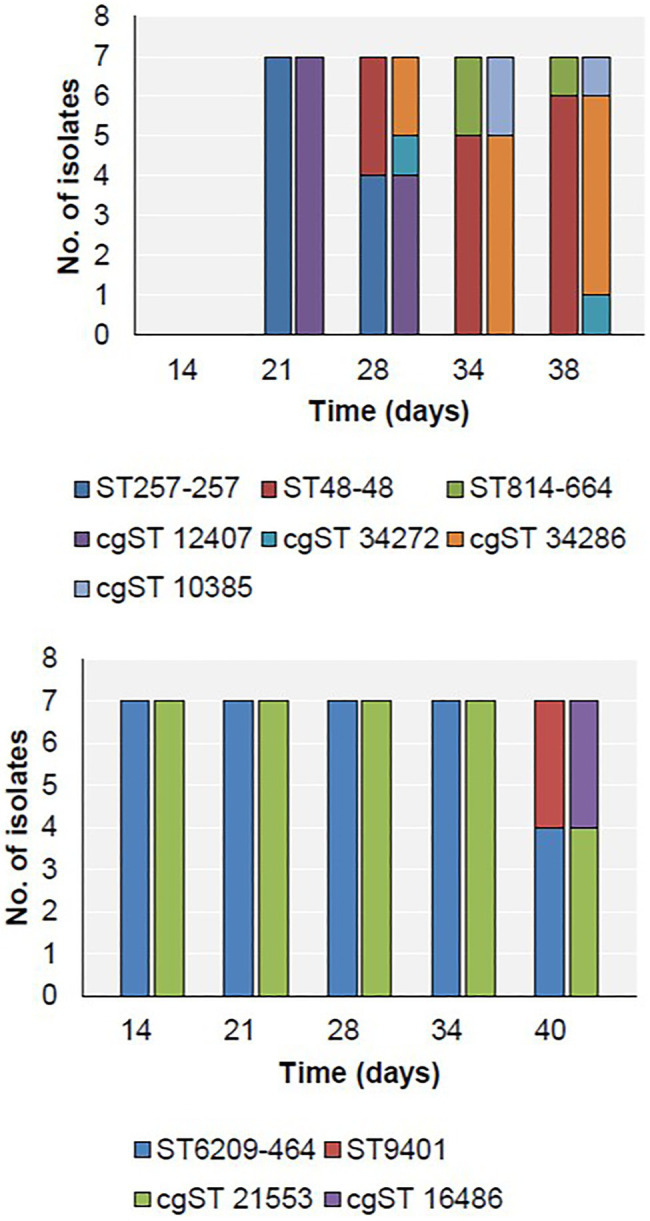
Figure 3.

Distribution of MLST (first bar at each time point) and cgST types (second bar at each time point) in Farm 1 (top) and Farm 2 (bottom).

Distribution of MLST (first bar at each time point) and cgST types (second bar at each time point) in Farm 1 (top) and Farm 2 (bottom).