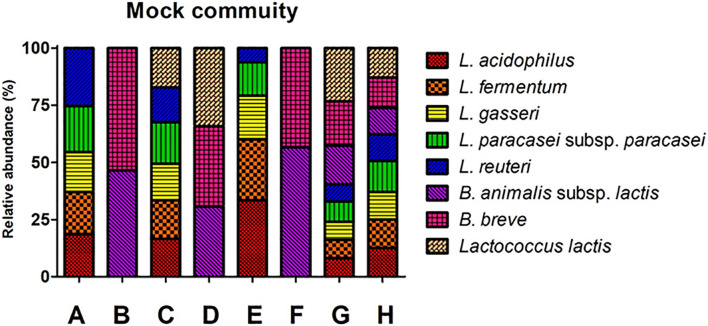
FIGURE 1.
Structures of eight mock communities based on copy number. The percent number in the graph indicates the ratio of each community. A and E: Lactobacillus group, B and F: Bifidobacterium group, C: Lactobacillus and Lactococcus group, B: Bifidobacterium and Lactococcus group, G and H: Lactobacillus, Bifidobacterium and Lactococcus group. The X-axis shows the mock community. The Y-axis indicates relative abundance.

