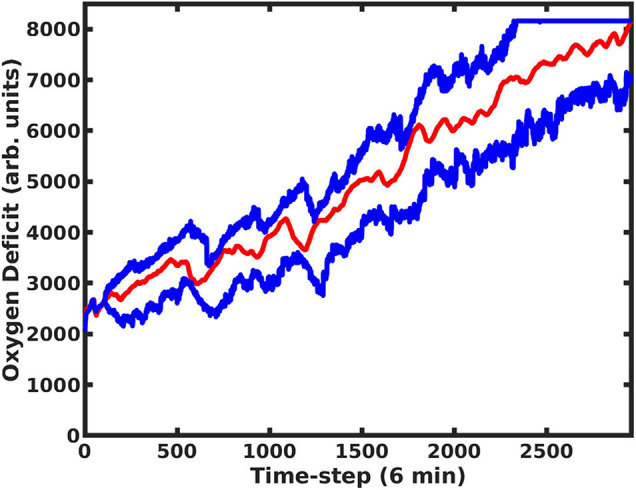
FIGURE 5.

Using the MLP Trajectory Forecast Model combined with the MLP Oxygen-Deficit Regressor, we determined the upper and lower boundaries for the future health-trajectory probability cone, which are indicated by the blue lines; the actual trajectory is plotted with a red line. Predictions began at t = 200 and were update upon every time-step.
