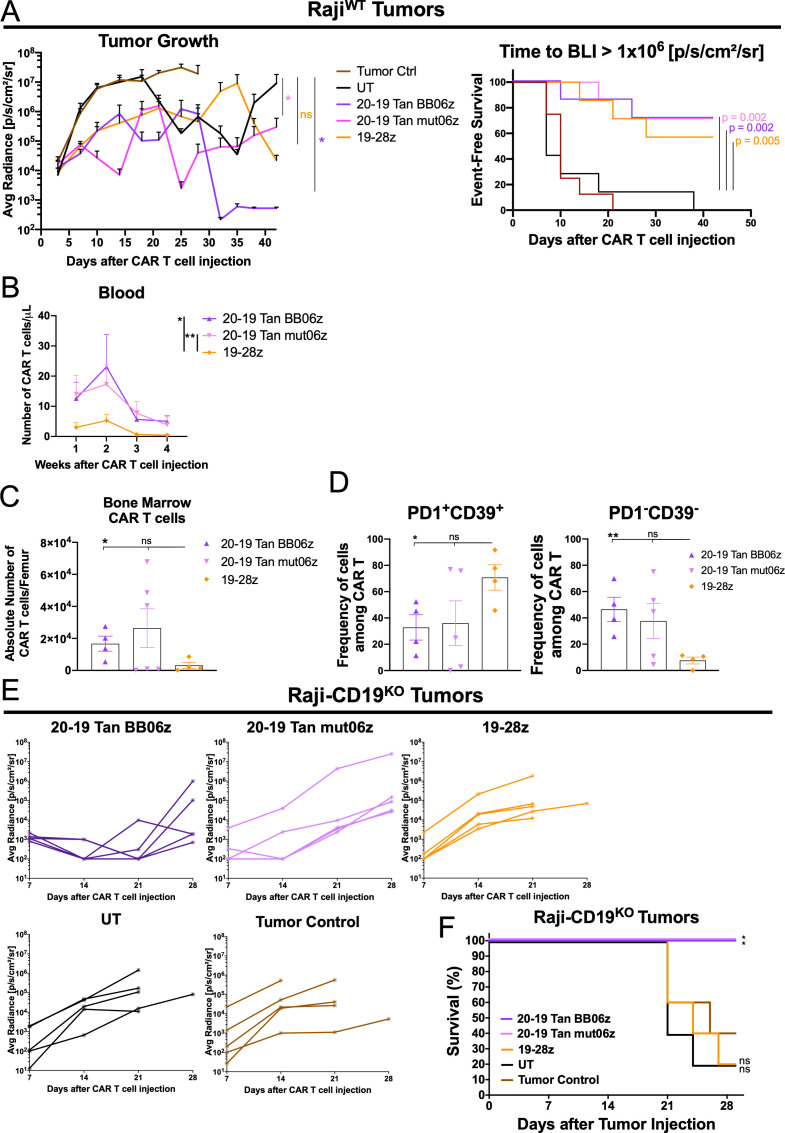
Figure 6.
CD20-CD19 Tan bi-specific chimeric antigen receptor (CAR) T cells show enhanced in vivo antitumor efficacy and low expression of exhaustion-associated markers. (A) Raji-FFLuc-bearing NSG mice were treated with 1×10⁶ CAR T cells 5 days after initial tumor cell injection. Average tumor burden (average radiance) of mice treated with bi-specific or mono-specific CAR T cells, untransduced T cell (UT) and tumor control. Data are shown as mean±SEM. Two-way analysis of variance (ANOVA) was performed with Dunnet’s multiple comparison test against UT (left). Kaplan-Meier analysis of event-free survival defined as time in days to an average luminescence equal or greater than 1×10⁶ p/s/cm2/sr of mice treated with 1×10⁶ T/CAR T cells compared with UT control (right). *p<0.05. (B) Total number of CAR T cells per μL of blood of tumor-bearing mice treated with the different CAR T cells (each point is 1 mouse). Two-way ANOVA was performed with Dunnet’s multiple comparison test against 19-28z condition. *p<0.05, **p<0.01. (C) Total number of CAR T cells per femur of tumor-bearing mice treated with different CAR T cells (each point is 1 mouse). (D) Expression of PD1 and CD39 among CAR+ cells harvested from the bone marrow of tumor-bearing mice treated with different CAR T cells (n=7 mice per group). Data are shown as mean±SEM. One-way ANOVA was performed with Dunnet’s multiple comparison test against the 19-28z condition. (E) RajiCD19KO-bearing NSG mice were treated with 1×10⁶ CAR T cells 5 days after initial tumor cell injection. Tumor burden (average radiance) of mice treated with bi-specific or mono-specific CAR T cells, UT and tumor control. Each line represents an individual mouse (n=5 mice per group). (F) Kaplan-Meier analysis of survival of mice treated with 1×10⁶ T/CAR T cells compared with tumor only control (n=5 mice per group). P values were determined by a one-sided log-rank Mantel-Cox test. NS, not significant; *p<0.05, **p<0.01. All conditions were normalized to the lowest CAR expression using UT cells, reaching same number of CAR-T cells and total T cells per group. See also online supplemental figure S5.

