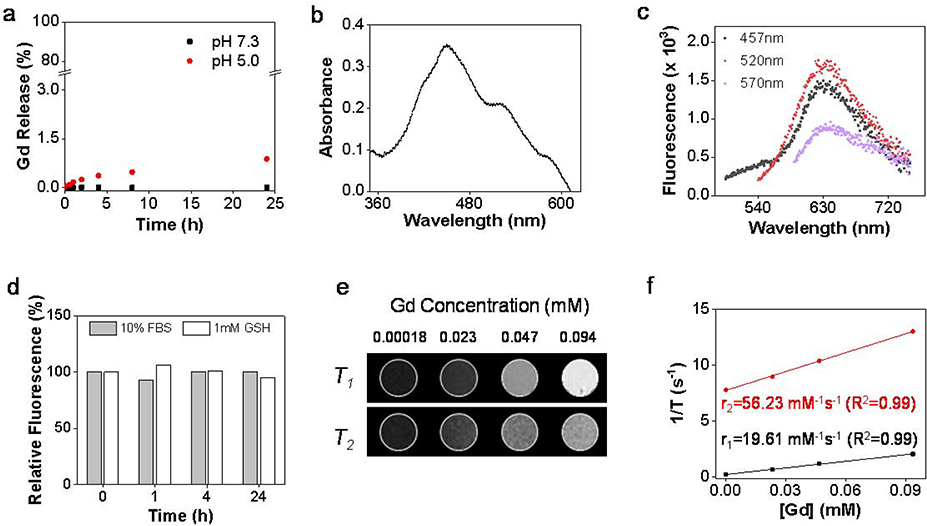
Figure 2.
Physical characterizations of Gd@Cdots. (a) Gd3+ released from Gd@Cdots in neutral and acidic solutions (pH 7.0 and 5.0) at 37 ºC for 24 h, evaluated by ICP-MS. (b) Absorbance spectrum of Gd@Cdots. There peaks at 457, 520, and 570 nm were observed. (c) Fluorescence spectra of Gd@Cdots. Emission peaks around 630 nm were observed when the nanoparticles were excited by 457, 520, and 570 nm light. (d) Fluorescence intensitiy when Gd@Cdots were incubated in 10% FBS or 1 mM GSH for 24 h at 37 ºC. Compared to pre-incubation solutions, minimal fluorescence change was observed over the incubation, indicating high stability of the nanoparticles. e&f), phantom studies with Gd@Cdots agarose gel samples (Gd concentration 0.00018–0.094 mM), measured on a 7 T magnet. (e) T1 and T2 MR images of Gd@Cdots gel samples. (f) r1 and r2 relaxation of Gd@Cdots, evaluated based on results from e).

