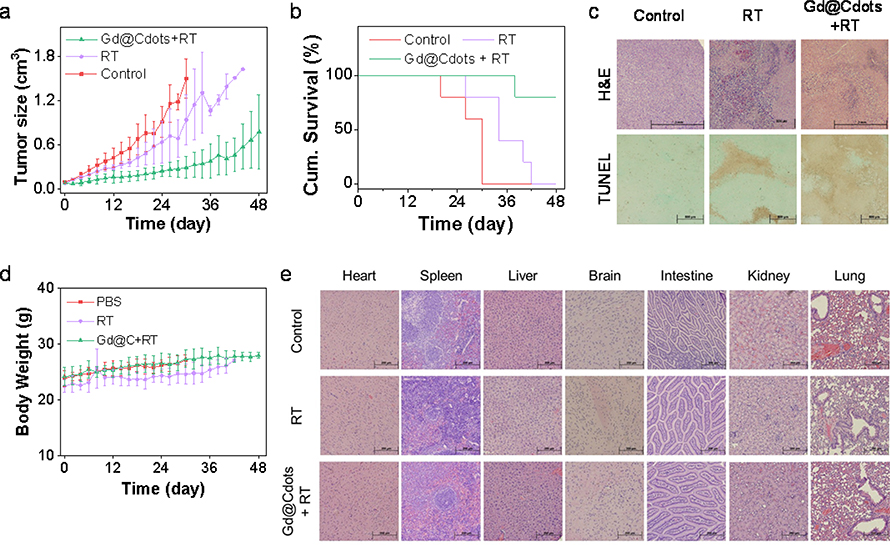
Figure 7.
In vivo therapy results, tested in a H1299 bearing xenograft model. The animals were treated with Gd@Cdots (0.1 mmol·Gd/kg) plus 6 Gy radiation (Gd@Cdots+RT), radiation only (RT), or PBS only (n = 5). (a) Tumor growth curves. *, p < 0.05. (b) Kaplan Meir survival curves. (c) Histology analysis of tumor samples. Both H&E and TUNEL assays were performed. Scale bars, 500 μm. (d) Body weight curves. No significant body weight drop was observed throughout the studies. (e) Histology analysis of major organ samples by H&E staining. Scale bars, 200 μm.

