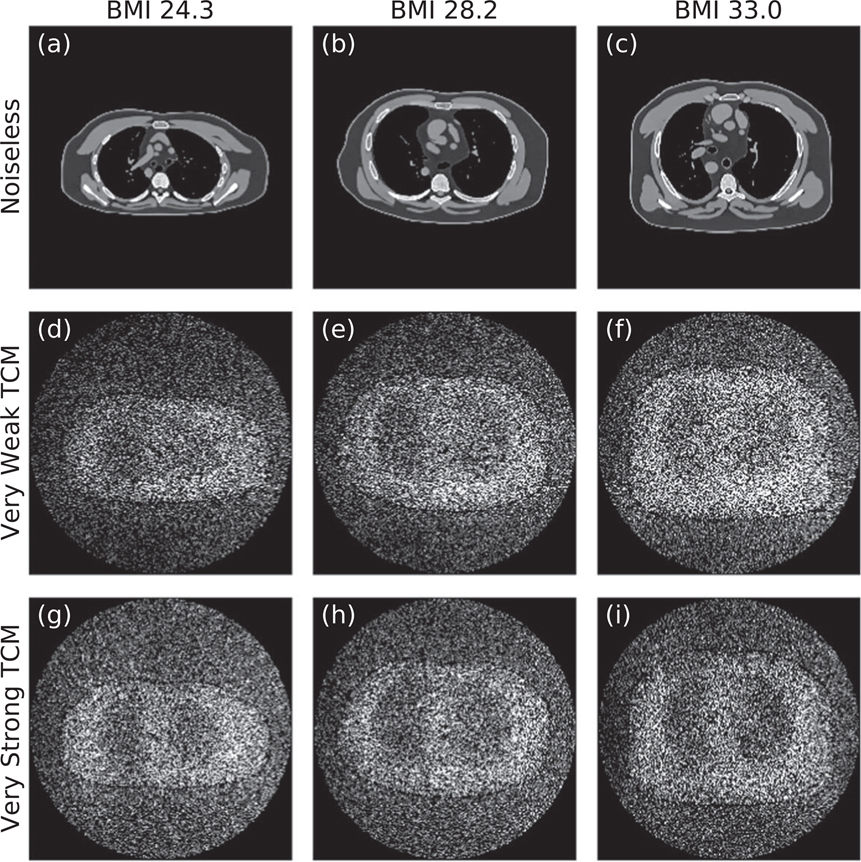
Figure 11.
(a)–(c) Noiseless reconstructed images for the three phantoms (BMIs 24.3, 28.2, and 33.0 from left to right) at window width of 400 HU and a window level of 50 HU. (d)–(f) Corresponding noise profiles for the ‘Very Weak’ TCM simulations. (g)–(i) Corresponding noise profiles for the ‘Very Strong’ TCM simulations. Noise profiles are shown with intensities ranging from 10 to 50 HU. All images are for the central reconstructed slice (z location of 143.1 mm).

