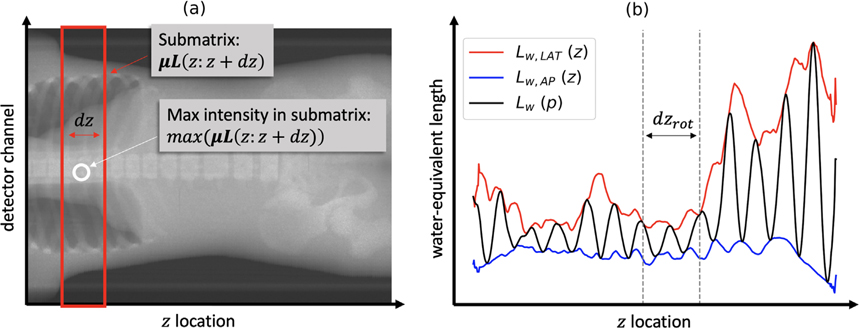
Figure 2.
Schematic diagram illustrating the process of converting two localizer radiographs into one projection-level water-equivalent length profile. (a) An example localizer μLAP is shown with one submatrix μL(z: z + dz) boxed in red and its maximum intensity max (μL(z: z + dz)) circled in white. (b) The vectors Lw,LAT (z) and Lw,AP (z) are used to compute Lw (p) for a predefined dzrot and an initial tube angle ϕ = 0.

