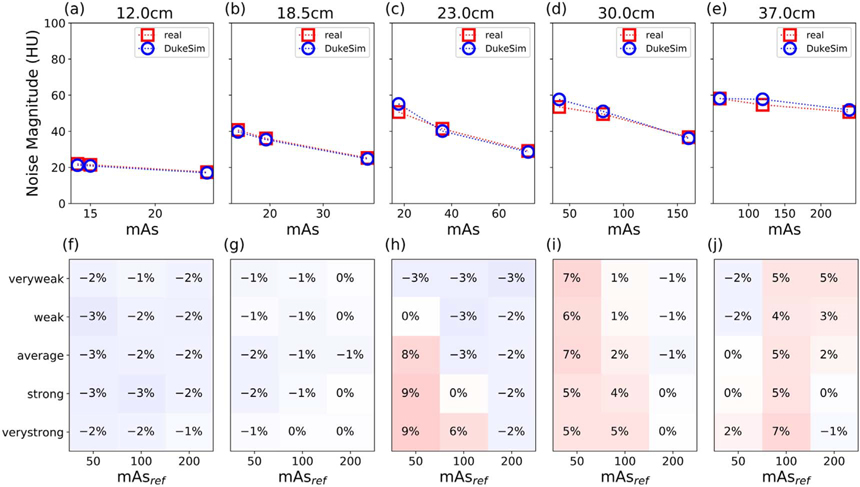
Figure 4.
(a)–(e) Noise magnitude comparison for one TCM strength (Average) at three reference mAs (50, 100, and 200) in the five Mercury phantom diameters. The mAs of each slice was calculated as the average mAs of projections used in its reconstruction. (f)–(j) Heat map of the relative error in noise magnitude for all five TCM strengths and three reference mAs. Notably, error is typically small (±3%) but increases slightly in the low-dose regime (higher attenuating diameter and lower reference mAs).

