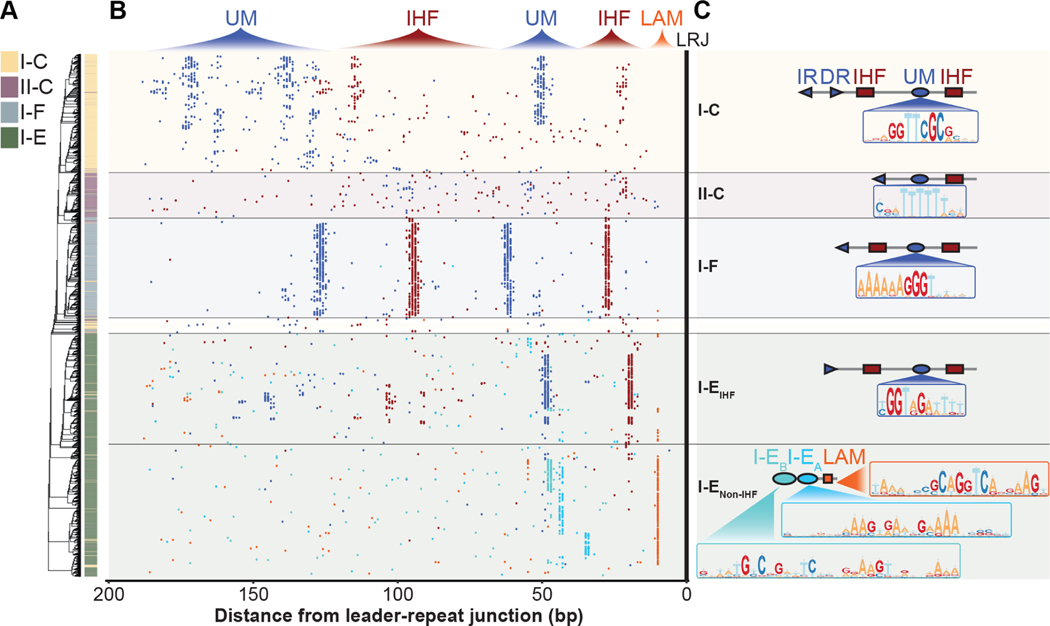
Figure 2. IHF-directed CRISPR adaptation is widespread.
(A) Phylogenetic tree generated from alignment of 200 bp of I-C, II-C, I-F and I-E CRISPR leaders and the first repeat. (B) Distributions of motifs within I-C, II-C, I-F and I-E CRISPR leaders. Each dot represents the midpoint of IHF binding sites (red), subtype specific upstream motifs (UMs) (dark blue), I-EA (cyan), or I-EB (teal), Leader Anchoring Motif (orange). Many of the leaders shown possess proximal IHF and UMs found between 0–70 bp upstream of the leader-repeat junction (LRJ), and distal IHF and UMs found 70–200 bp upstream of the LRJ. (C) Schematic of the prominent architecture for motifs within I-C, II-C, I-F and I-E CRISPR leaders. Position weight matrices are shown for subtype specific upstream motifs, and motifs found in I-E leaders that do not contain IHF binding sites (Data S1). See also Figure S1.

