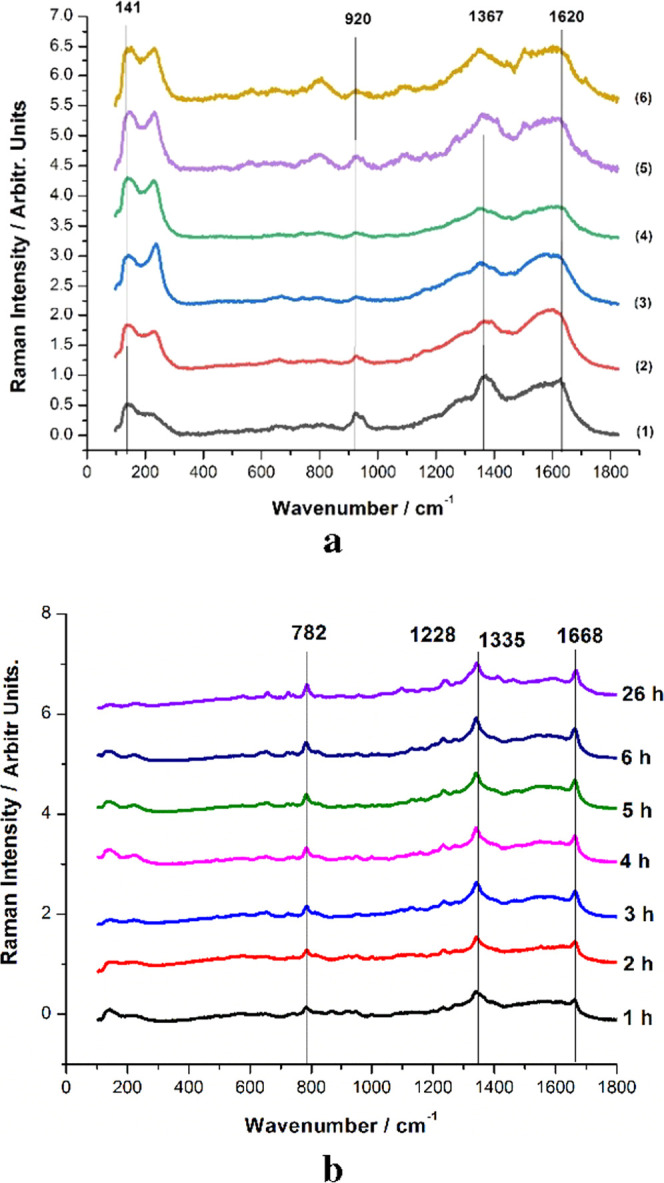
Figure 11.

Averaged and normalized SERS spectra of the samples collected from the solution containing the tablet in the first hour (a) and in the following 5.5 h (b). The SERS spectra from the blank powder suspended in water are given in the bottom line of (a) and denoted as (1). The numbers indicate the SERS of solutions taken after 10 (2), 20 (3), 30 (4), 40 (5), and 50 min (6).
