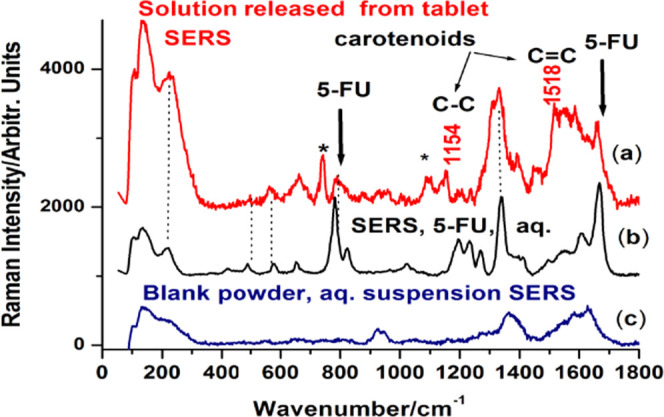
Figure 6.

Typical SERS spectrum (background subtracted) recorded from the released solution from a tablet loaded with 5-FU (a) compared to the SERS of pure 5-FU aqueous solution (b) and the signal recorded from blank powder in water suspension (c). The * symbol denotes other bands from the biogenic composition.
