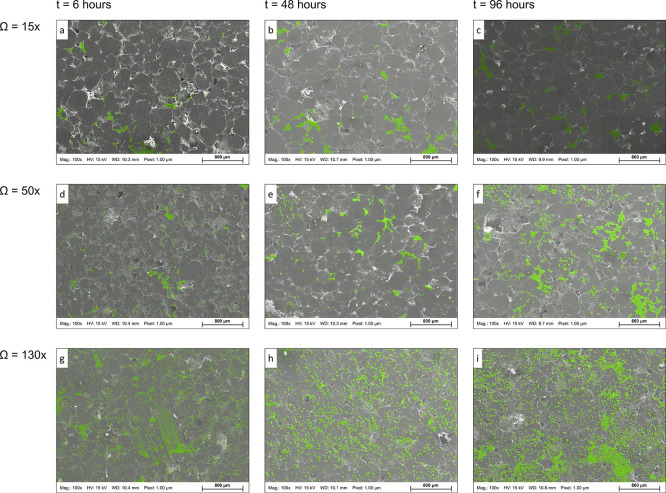
Figure 1.
Surface maps of heterogeneous sandstone substrates at different supersaturations (Ω) and elapsed times from the onset of the experiment (t) for the laboratory tests conducted at temperature T = 60 °C. Top: Ω = 15 (a–c), middle: Ω = 50 (d–f), and bottom: 130 (g–i).The mosaic maps demonstrate the superimposed EDS on top of the BSE SEM to identify calcium carbonate crystals (color-coded in green). Each mosaic map consists of nine BSE SEM images (3 × 3) covering approximately 10.5 mm2, with a spatial resolution of 1 μm. Magnification: 100×.

