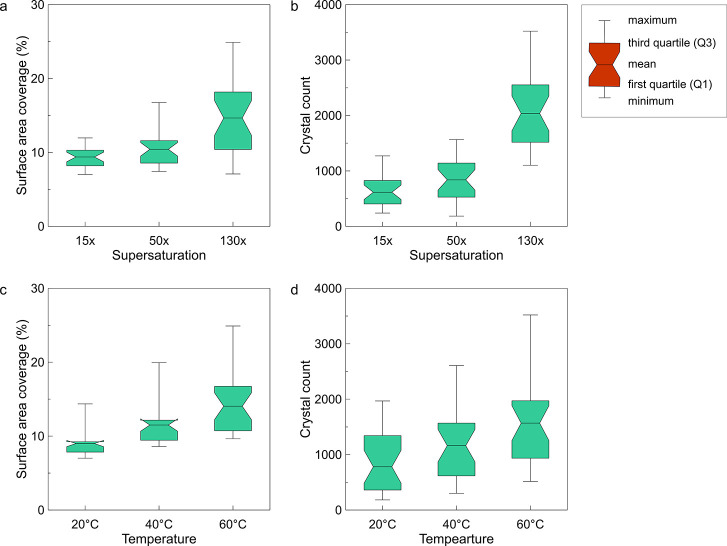
Figure 3.
Box plots of total surface area coverage (%) and the number of precipitated crystals vs (top, a,b) supersaturation and (bottom, c,d) temperature, obtained by image analysis along with the skewness, quartiles, and mean value. The whiskers indicate variability outside the upper and lower quartiles (25 and 75%) and represent the minimum and maximum values.

