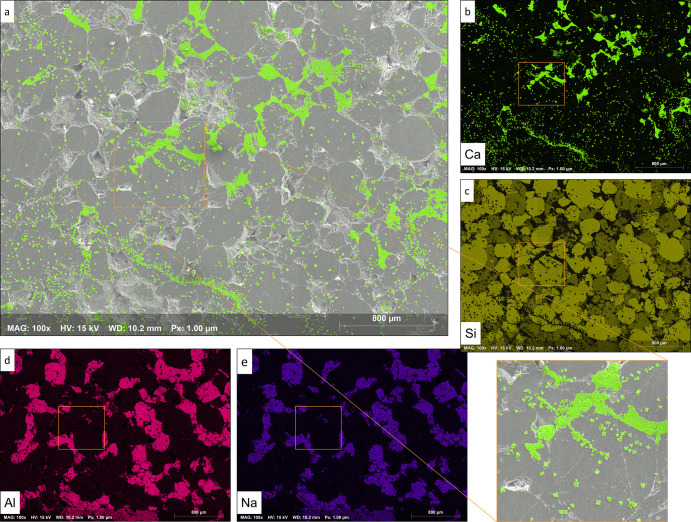
Figure 7.
EDS elemental phase maps of mineral formation on a multi-mineral heterogeneous substrate and preferential affinity for nucleation and growth. (a) SEM–EDS surface map with calcium carbonate crystals color-coded in green, a magnified section of the mosaic map, along with elemental phase maps of (b) calcium (Ca) representing calcite, (c) silica (Si) representing quartz, and (d) aluminum (Al) and (e) sodium (Na) both representing feldspar grains. Magnification = 100× and length scale = 800 μm.

