
Figure 2. PHGDH inhibition causes attenuation of cellular proliferation and TCA cycle activity.
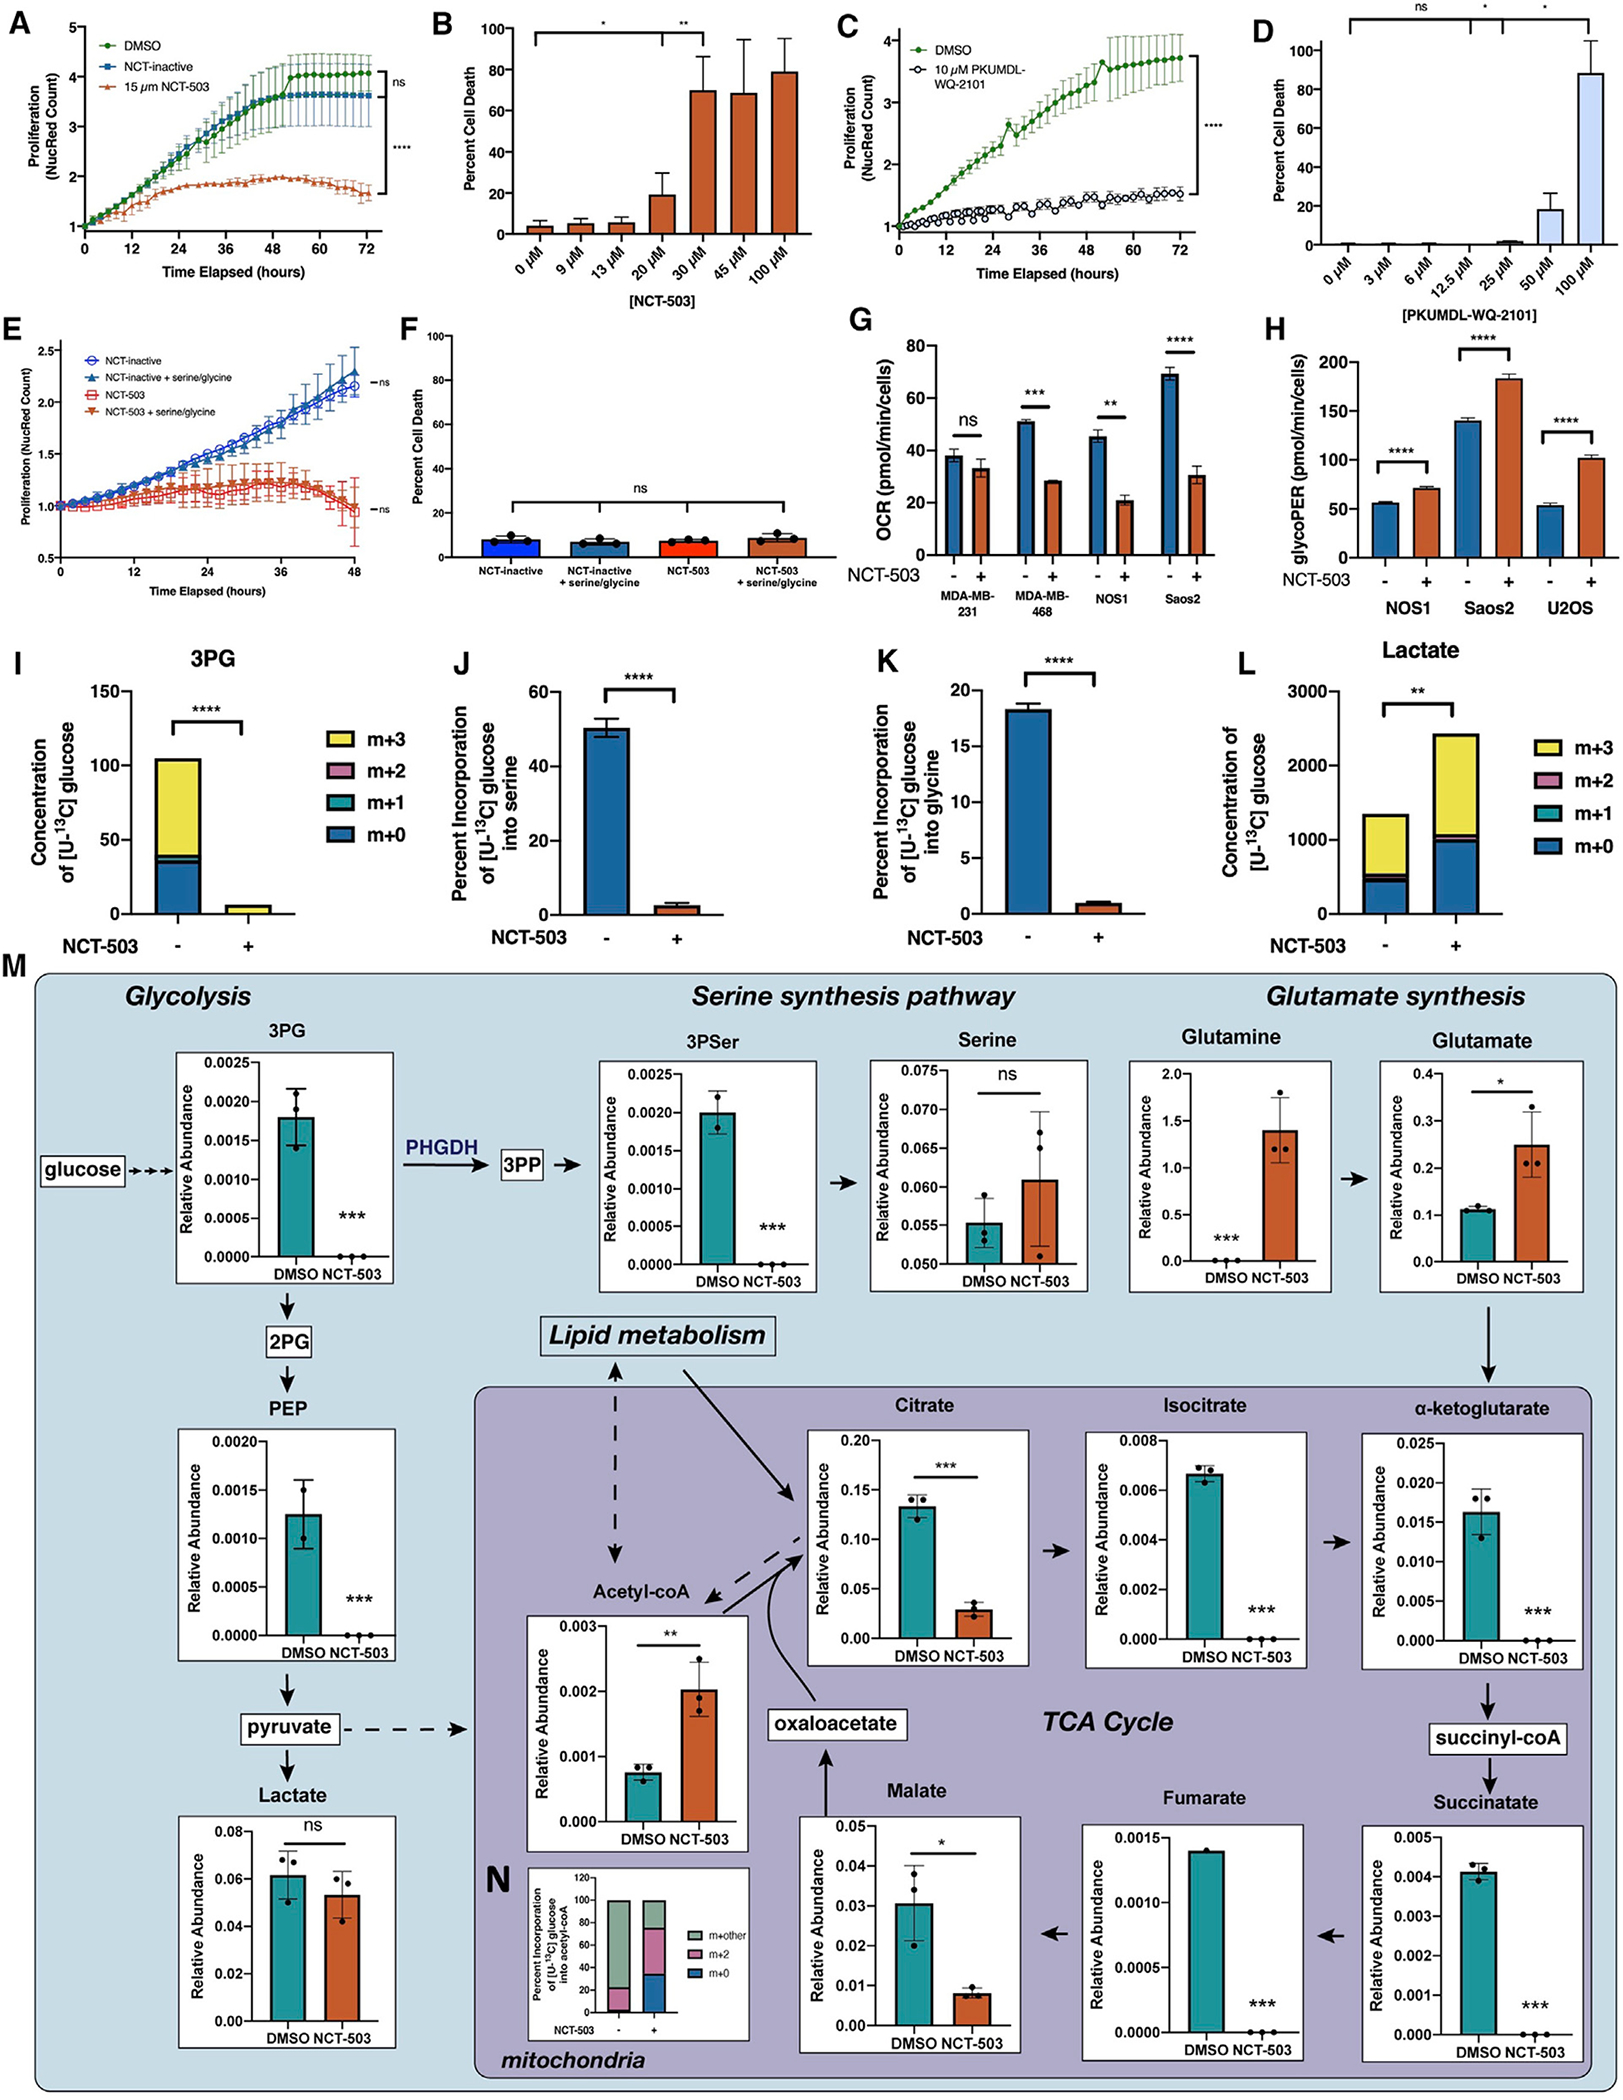
(A) Nuclear red count in NOS1 cells treated with DMSO (vehicle control), 10 μM NCT-503 inactive control, or 15 μM NCT-503.
(B) Percentage of cell death at 72 h in NOS1 cells treated with increasing doses of NCT-503.
(C) Nuclear red count in NOS1 cells treated with DMSO or 10 μM PKUMDL-WQ-2101.
(D) Percentage of cell death at 72 h in NOS1 cells treated with increasing doses of PKUMDL-WQ-2101.
(E and F) Nuclear red count (E) and percentage of cell death (F) in NOS1 cells cultured with media containing dialyzed fetal bovine serum (FBS) ± supplementation with 286 μM serine and glycine and treated with NCT-inactive or NCT-503.
(G) Oxygen consumption rate (OCR) for MDA-MB-231, MDA-MB-468, NOS1, and Saos2 cells treated with NCT-inactive or NCT-503.
(H) Glycolytic proton efflux rate (GlycoPER) for NOS1, Saos2, and U2OS cells treated with NCT-inactive or NCT-503.
(I) Concentration of 13C and unlabeled C in 3PG in Saos2 cells treated with NCT-inactive or NCT-503.
(J and K) Percentage of incorporation of [U-13C] labeled glucose into serine (J) and glycine in Saos2 cells treated with NCT-inactive or NCT-503 (K).
(L) Concentration of 13C and unlabeled C in lactate in Saos2 cells treated with NCT-inactive or NCT-503.
(M) Metabolite levels in NOS1 cells treated with DMSO or NCT-503 for 48 h. Dashed lines indicate potential sources of acetyl-coA.
(N) Percentage of incorporation of [U-13C] labeled glucose into carbons of acetyl-coA in Saos2 cells treated with NCT-inactive or NCT-503.
3PP, 3-phosphohydroxypyruvate; 3PSer, 3-phophoserine. Bars represent means of values; error bars represent SEM. All assays were conducted with n = 3 replicates. *p < 0.05, **p < 0.01, ***p < 0.005, ****p < 0.001.