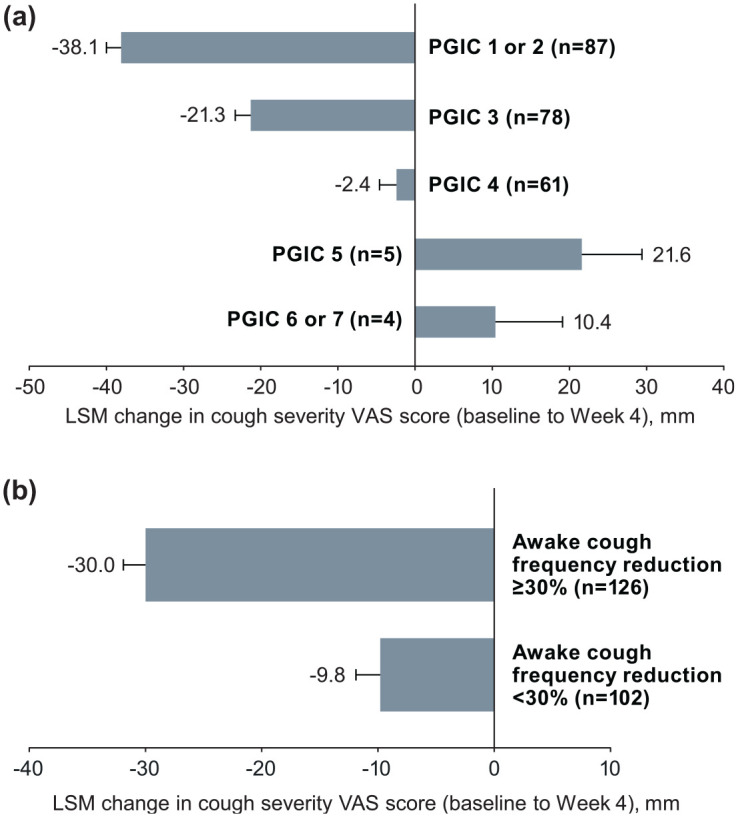
Figure 1.

Responsiveness of cough severity VAS change scores by (a) PGIC category at Week 4 and (b) ⩾ 30% vs. < 30% reduction in awake cough frequency at Week 4. Error bars are standard error.
LSM, least-squares mean; PGIC, patient global impression of change; VAS, visual analog scale.
