
Figure 1.
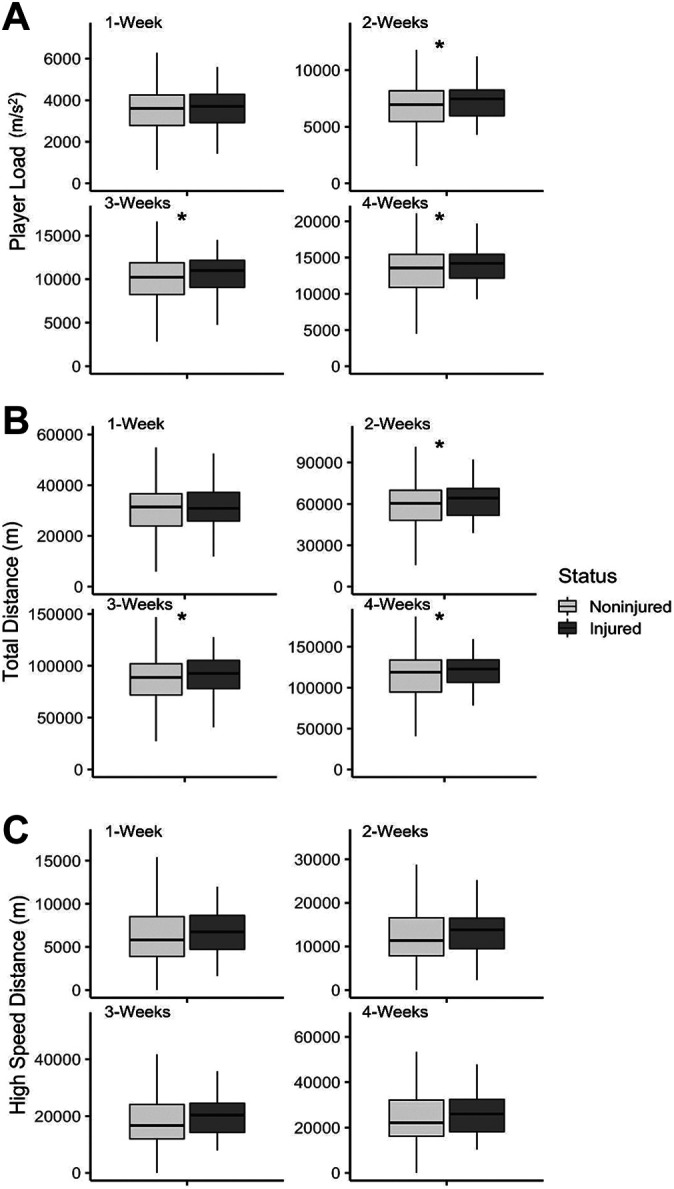
Comparison between noninjured and injured players for 1-, 2-, 3-, and 4-week accumulated (A) player load, (B) total distance, and (C) high-speed distance. *Significant difference between noninjured and injured players (P < .05).
Official websites use .gov
A
.gov website belongs to an official
government organization in the United States.
Secure .gov websites use HTTPS
A lock (
) or https:// means you've safely
connected to the .gov website. Share sensitive
information only on official, secure websites.
Comparison between noninjured and injured players for 1-, 2-, 3-, and 4-week accumulated (A) player load, (B) total distance, and (C) high-speed distance. *Significant difference between noninjured and injured players (P < .05).