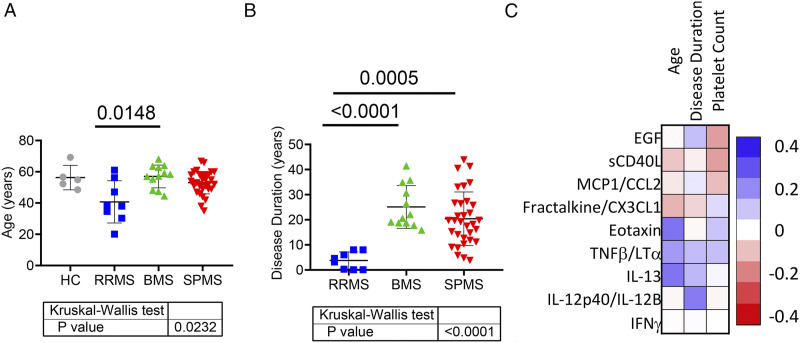
Figure 2.
Correlation analysis of plasma cytokine levels against age, disease duration, and platelet count. Ages of all participants (A) and disease duration (B) of all MS patients in this study were analyzed using the Kruskal–Wallis test. Statistically significant P values between groups calculated using Dunn’s adjusted multiple comparison are shown above horizontal lines. Spearman rank correlation analysis was performed using the plasma levels of 8 most significantly different cytokines among different groups against age, disease duration, and circulating platelet count of corresponding individuals. Their correlation coefficient values are shown in scale of color as matrix (C). HC (n = 5), RRMS (n = 8), BMS (n = 12), and SPMS (n = 32).

