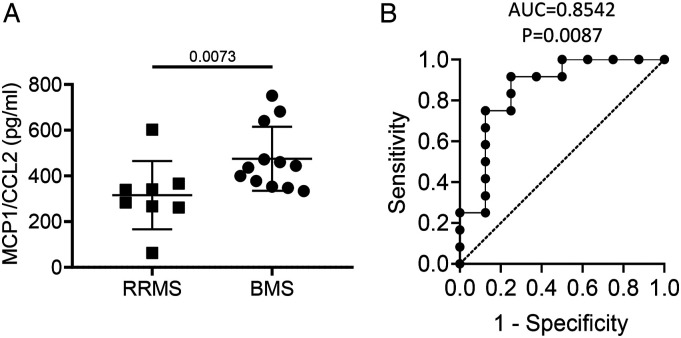
Figure 4.
Plasma levels of MCP1/CCL2 discriminate BMS from RRMS. Plasma concentration of MCP1/CCL2 derived from RRMS and BMS patients were compared along with their ROC plots. (A) Column scatter graph comparing plasma level of MCP1/CCL2 of RRMS group (n = 8) with BMS group (n = 12). P value using Mann–Whitney test are shown above the line. (B) ROC analysis using MCP/CCL2 to discriminate BMS from RRMS. ROC, receiver-operating characteristic; AUC, area under curve.

